TennesseeValley TVC full analysis,charts,indicators,moving averages,SMA,DMA,EMA,ADX,MACD,RSITennessee Valley TVC WideScreen charts, DMA,SMA,EMA technical analysis, forecast prediction, by indicators ADX,MACD,RSI,CCI NYSE stock exchange
operates under Public Utilities sector & deals in Electric Utilities Central
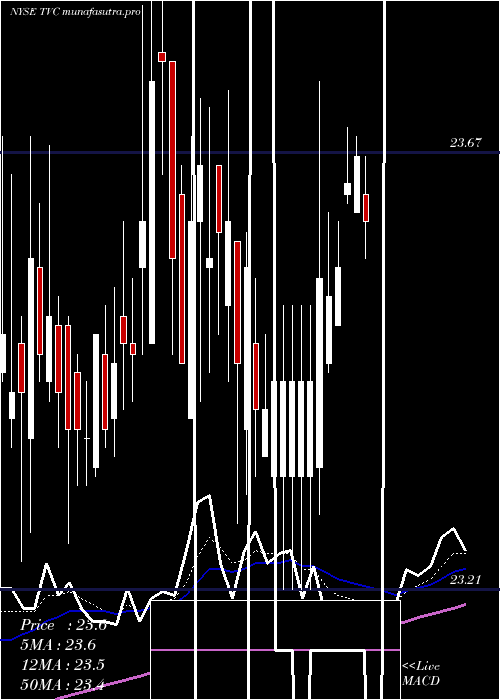
Daily price and charts and targets TennesseeValley Strong Daily Stock price targets for TennesseeValley TVC are 24.15 and 24.33 | Daily Target 1 | 24 | | Daily Target 2 | 24.12 | | Daily Target 3 | 24.18 | | Daily Target 4 | 24.3 | | Daily Target 5 | 24.36 |
Daily price and volume Tennessee Valley
| Date |
Closing |
Open |
Range |
Volume |
Thu 04 December 2025 |
24.24 (0.37%) |
24.10 |
24.06 - 24.24 |
0.3387 times |
Wed 03 December 2025 |
24.15 (0%) |
24.15 |
24.05 - 24.20 |
4.0304 times |
Tue 02 December 2025 |
24.15 (0.33%) |
24.14 |
24.06 - 24.15 |
2.4058 times |
Mon 01 December 2025 |
24.07 (-0.21%) |
24.18 |
24.05 - 24.25 |
0.1659 times |
Fri 28 November 2025 |
24.12 (0.08%) |
24.06 |
24.04 - 24.13 |
1.2686 times |
Wed 26 November 2025 |
24.10 (-0.41%) |
24.13 |
24.07 - 24.20 |
0.2212 times |
Tue 25 November 2025 |
24.20 (-0.04%) |
24.20 |
24.10 - 24.20 |
0.3802 times |
Mon 24 November 2025 |
24.21 (0.33%) |
24.15 |
24.11 - 24.21 |
0.7397 times |
Fri 21 November 2025 |
24.13 (-0.04%) |
24.19 |
24.04 - 24.19 |
0.1521 times |
Thu 20 November 2025 |
24.14 (0%) |
24.12 |
24.08 - 24.14 |
0.2973 times |
Wed 19 November 2025 |
24.14 (-0.25%) |
24.21 |
24.05 - 24.21 |
1.0439 times |
Weekly price and charts TennesseeValley Strong weekly Stock price targets for TennesseeValley TVC are 24.15 and 24.35 | Weekly Target 1 | 23.98 | | Weekly Target 2 | 24.11 | | Weekly Target 3 | 24.18 | | Weekly Target 4 | 24.31 | | Weekly Target 5 | 24.38 |
Weekly price and volumes for Tennessee Valley
| Date |
Closing |
Open |
Range |
Volume |
Thu 04 December 2025 |
24.24 (0.5%) |
24.18 |
24.05 - 24.25 |
2.7384 times |
Fri 28 November 2025 |
24.12 (-0.04%) |
24.15 |
24.04 - 24.21 |
1.0296 times |
Fri 21 November 2025 |
24.13 (0.04%) |
24.11 |
24.01 - 24.21 |
0.8196 times |
Fri 14 November 2025 |
24.12 (0.12%) |
24.06 |
23.98 - 24.22 |
1.2696 times |
Fri 07 November 2025 |
24.09 (0.67%) |
24.13 |
23.98 - 24.13 |
1.286 times |
Fri 31 October 2025 |
23.93 (0%) |
24.00 |
23.90 - 24.13 |
0.5019 times |
Fri 31 October 2025 |
23.93 (-0.66%) |
24.04 |
23.90 - 24.17 |
1.0078 times |
Fri 24 October 2025 |
24.09 (0.21%) |
24.04 |
24.04 - 24.33 |
0.5005 times |
Fri 17 October 2025 |
24.04 (-0.46%) |
24.01 |
23.90 - 24.15 |
0.585 times |
Tue 07 October 2025 |
24.15 (0.62%) |
24.03 |
23.91 - 24.18 |
0.2616 times |
Fri 03 October 2025 |
24.00 (0.59%) |
24.01 |
23.83 - 24.15 |
1.1734 times |
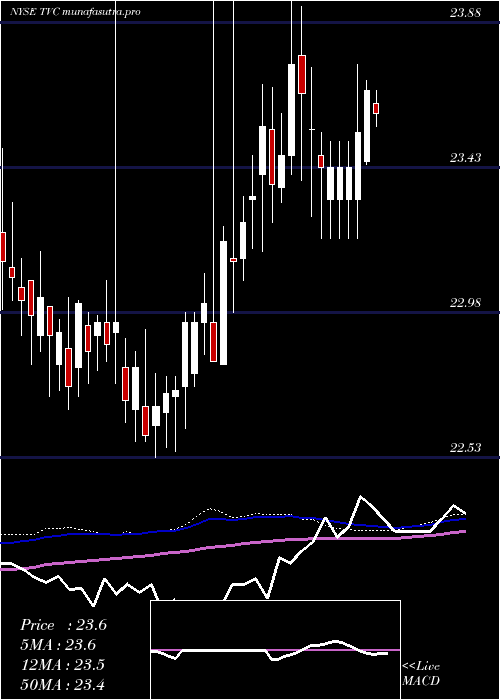
Monthly price and charts TennesseeValley Strong monthly Stock price targets for TennesseeValley TVC are 24.15 and 24.35 | Monthly Target 1 | 23.98 | | Monthly Target 2 | 24.11 | | Monthly Target 3 | 24.18 | | Monthly Target 4 | 24.31 | | Monthly Target 5 | 24.38 |
Monthly price and volumes Tennessee Valley
| Date |
Closing |
Open |
Range |
Volume |
Thu 04 December 2025 |
24.24 (0.5%) |
24.18 |
24.05 - 24.25 |
0.5241 times |
Fri 28 November 2025 |
24.12 (0.79%) |
24.13 |
23.98 - 24.22 |
0.843 times |
Fri 31 October 2025 |
23.93 (0.29%) |
23.93 |
23.86 - 24.33 |
0.6275 times |
Tue 30 September 2025 |
23.86 (0.8%) |
23.69 |
23.56 - 24.25 |
0.7858 times |
Fri 29 August 2025 |
23.67 (-0.92%) |
23.85 |
23.47 - 24.02 |
1.1593 times |
Thu 31 July 2025 |
23.89 (2.09%) |
23.49 |
23.42 - 23.89 |
0.6653 times |
Mon 30 June 2025 |
23.40 (-0.93%) |
23.64 |
23.30 - 23.79 |
1.4082 times |
Fri 30 May 2025 |
23.62 (-0.25%) |
23.71 |
23.15 - 23.84 |
0.914 times |
Wed 30 April 2025 |
23.68 (-0.38%) |
23.77 |
23.21 - 23.77 |
0.8472 times |
Mon 31 March 2025 |
23.77 (1.84%) |
23.41 |
23.17 - 24.05 |
2.2255 times |
Fri 28 February 2025 |
23.34 (2.23%) |
22.82 |
22.82 - 24.00 |
1.2044 times |

DMA SMA EMA moving averages of Tennessee Valley TVC
DMA (daily moving average) of Tennessee Valley TVC
| DMA period | DMA value | | 5 day DMA | 24.15 | | 12 day DMA | 24.15 | | 20 day DMA | 24.12 | | 35 day DMA | 24.09 | | 50 day DMA | 24.07 | | 100 day DMA | 23.95 | | 150 day DMA | 23.82 | | 200 day DMA | 23.73 | EMA (exponential moving average) of Tennessee Valley TVC
| EMA period | EMA current | EMA prev | EMA prev2 | | 5 day EMA | 24.17 | 24.14 | 24.13 | | 12 day EMA | 24.14 | 24.12 | 24.12 | | 20 day EMA | 24.11 | 24.1 | 24.1 | | 35 day EMA | 24.09 | 24.08 | 24.08 | | 50 day EMA | 24.08 | 24.07 | 24.07 |
SMA (simple moving average) of Tennessee Valley TVC
| SMA period | SMA current | SMA prev | SMA prev2 | | 5 day SMA | 24.15 | 24.12 | 24.13 | | 12 day SMA | 24.15 | 24.14 | 24.14 | | 20 day SMA | 24.12 | 24.11 | 24.11 | | 35 day SMA | 24.09 | 24.09 | 24.09 | | 50 day SMA | 24.07 | 24.07 | 24.07 | | 100 day SMA | 23.95 | 23.95 | 23.94 | | 150 day SMA | 23.82 | 23.82 | 23.81 | | 200 day SMA | 23.73 | 23.72 | 23.72 |
|
|
