GrupoTelevisa TV full analysis,charts,indicators,moving averages,SMA,DMA,EMA,ADX,MACD,RSIGrupo Televisa TV WideScreen charts, DMA,SMA,EMA technical analysis, forecast prediction, by indicators ADX,MACD,RSI,CCI NYSE stock exchange
operates under Consumer Services sector & deals in Broadcasting
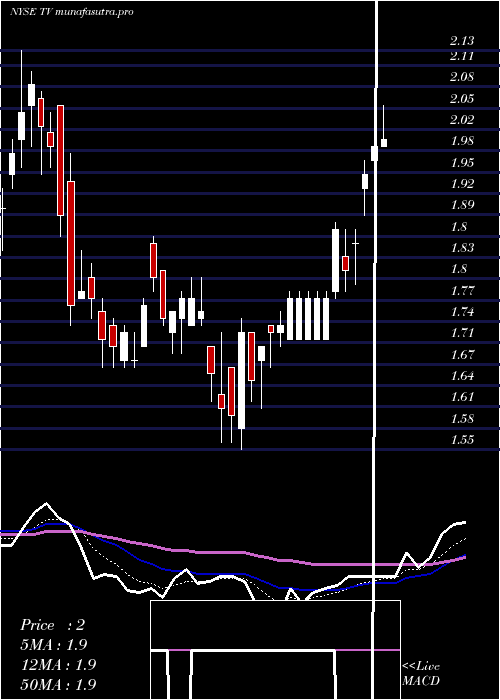
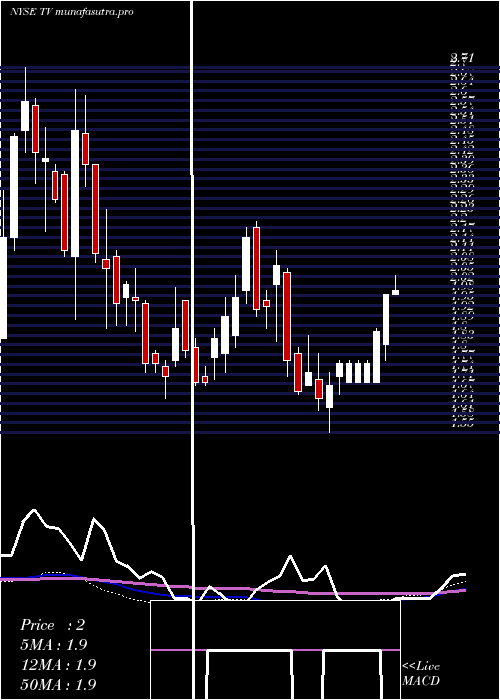
Daily price and charts and targets GrupoTelevisa Strong Daily Stock price targets for GrupoTelevisa TV are 2.73 and 2.8 | Daily Target 1 | 2.67 | | Daily Target 2 | 2.71 | | Daily Target 3 | 2.7366666666667 | | Daily Target 4 | 2.78 | | Daily Target 5 | 2.81 |
Daily price and volume Grupo Televisa
| Date |
Closing |
Open |
Range |
Volume |
Thu 04 December 2025 |
2.76 (1.1%) |
2.75 |
2.69 - 2.76 |
0.5048 times |
Wed 03 December 2025 |
2.73 (0.37%) |
2.74 |
2.70 - 2.75 |
0.6441 times |
Tue 02 December 2025 |
2.72 (0.74%) |
2.72 |
2.72 - 2.76 |
0.574 times |
Mon 01 December 2025 |
2.70 (-0.37%) |
2.72 |
2.69 - 2.76 |
1.2666 times |
Fri 28 November 2025 |
2.71 (0%) |
2.69 |
2.67 - 2.76 |
0.4331 times |
Wed 26 November 2025 |
2.71 (0%) |
2.74 |
2.70 - 2.76 |
0.4857 times |
Tue 25 November 2025 |
2.71 (-1.09%) |
2.77 |
2.71 - 2.79 |
2.6043 times |
Mon 24 November 2025 |
2.74 (-1.08%) |
2.72 |
2.71 - 2.79 |
1.5489 times |
Fri 21 November 2025 |
2.77 (1.84%) |
2.73 |
2.72 - 2.99 |
1.0942 times |
Thu 20 November 2025 |
2.72 (-2.86%) |
2.80 |
2.70 - 2.86 |
0.8443 times |
Wed 19 November 2025 |
2.80 (-1.41%) |
2.85 |
2.78 - 2.89 |
0.5166 times |
Weekly price and charts GrupoTelevisa Strong weekly Stock price targets for GrupoTelevisa TV are 2.73 and 2.8 | Weekly Target 1 | 2.67 | | Weekly Target 2 | 2.71 | | Weekly Target 3 | 2.7366666666667 | | Weekly Target 4 | 2.78 | | Weekly Target 5 | 2.81 |
Weekly price and volumes for Grupo Televisa
| Date |
Closing |
Open |
Range |
Volume |
Thu 04 December 2025 |
2.76 (1.85%) |
2.72 |
2.69 - 2.76 |
0.3742 times |
Fri 28 November 2025 |
2.71 (-2.17%) |
2.72 |
2.67 - 2.79 |
0.6348 times |
Fri 21 November 2025 |
2.77 (-5.46%) |
2.91 |
2.70 - 2.99 |
0.4914 times |
Fri 14 November 2025 |
2.93 (2.81%) |
2.83 |
2.83 - 3.10 |
0.6641 times |
Fri 07 November 2025 |
2.85 (7.95%) |
2.55 |
2.54 - 2.89 |
0.5457 times |
Fri 31 October 2025 |
2.64 (0%) |
2.70 |
2.62 - 2.74 |
0.1446 times |
Fri 31 October 2025 |
2.64 (10.46%) |
2.41 |
2.40 - 2.87 |
4.7831 times |
Fri 24 October 2025 |
2.39 (0%) |
2.40 |
2.37 - 2.46 |
1.9782 times |
Fri 17 October 2025 |
2.39 (-5.16%) |
2.37 |
2.34 - 2.50 |
0.2767 times |
Tue 07 October 2025 |
2.52 (-0.79%) |
2.54 |
2.51 - 2.74 |
0.1073 times |
Fri 03 October 2025 |
2.54 (-5.58%) |
2.71 |
2.53 - 2.72 |
0.4422 times |
Monthly price and charts GrupoTelevisa Strong monthly Stock price targets for GrupoTelevisa TV are 2.73 and 2.8 | Monthly Target 1 | 2.67 | | Monthly Target 2 | 2.71 | | Monthly Target 3 | 2.7366666666667 | | Monthly Target 4 | 2.78 | | Monthly Target 5 | 2.81 |
Monthly price and volumes Grupo Televisa
| Date |
Closing |
Open |
Range |
Volume |
Thu 04 December 2025 |
2.76 (1.85%) |
2.72 |
2.69 - 2.76 |
0.113 times |
Fri 28 November 2025 |
2.71 (2.65%) |
2.55 |
2.54 - 3.10 |
0.7056 times |
Fri 31 October 2025 |
2.64 (-1.86%) |
2.67 |
2.34 - 2.87 |
2.3085 times |
Tue 30 September 2025 |
2.69 (-3.58%) |
2.76 |
2.63 - 2.97 |
0.5059 times |
Fri 29 August 2025 |
2.79 (-0.36%) |
2.78 |
2.27 - 2.81 |
0.7229 times |
Thu 31 July 2025 |
2.80 (27.85%) |
2.19 |
2.03 - 2.89 |
1.0195 times |
Mon 30 June 2025 |
2.19 (14.66%) |
1.92 |
1.89 - 2.49 |
0.9561 times |
Fri 30 May 2025 |
1.91 (4.95%) |
1.81 |
1.67 - 2.11 |
1.2442 times |
Wed 30 April 2025 |
1.82 (4%) |
1.74 |
1.55 - 2.05 |
1.0974 times |
Mon 31 March 2025 |
1.75 (-10.26%) |
2.02 |
1.67 - 2.13 |
1.3267 times |
Fri 28 February 2025 |
1.95 (1.56%) |
1.86 |
1.82 - 2.22 |
0.8927 times |

DMA SMA EMA moving averages of Grupo Televisa TV
DMA (daily moving average) of Grupo Televisa TV
| DMA period | DMA value | | 5 day DMA | 2.72 | | 12 day DMA | 2.74 | | 20 day DMA | 2.81 | | 35 day DMA | 2.7 | | 50 day DMA | 2.67 | | 100 day DMA | 2.6 | | 150 day DMA | 2.42 | | 200 day DMA | 2.28 | EMA (exponential moving average) of Grupo Televisa TV
| EMA period | EMA current | EMA prev | EMA prev2 | | 5 day EMA | 2.73 | 2.72 | 2.72 | | 12 day EMA | 2.75 | 2.75 | 2.75 | | 20 day EMA | 2.75 | 2.75 | 2.75 | | 35 day EMA | 2.73 | 2.73 | 2.73 | | 50 day EMA | 2.68 | 2.68 | 2.68 |
SMA (simple moving average) of Grupo Televisa TV
| SMA period | SMA current | SMA prev | SMA prev2 | | 5 day SMA | 2.72 | 2.71 | 2.71 | | 12 day SMA | 2.74 | 2.74 | 2.76 | | 20 day SMA | 2.81 | 2.81 | 2.81 | | 35 day SMA | 2.7 | 2.69 | 2.68 | | 50 day SMA | 2.67 | 2.67 | 2.67 | | 100 day SMA | 2.6 | 2.6 | 2.59 | | 150 day SMA | 2.42 | 2.42 | 2.41 | | 200 day SMA | 2.28 | 2.27 | 2.27 |
|
|
