TelusCorporation TU full analysis,charts,indicators,moving averages,SMA,DMA,EMA,ADX,MACD,RSITelus Corporation TU WideScreen charts, DMA,SMA,EMA technical analysis, forecast prediction, by indicators ADX,MACD,RSI,CCI NYSE stock exchange
operates under Public Utilities sector & deals in Telecommunications Equipment
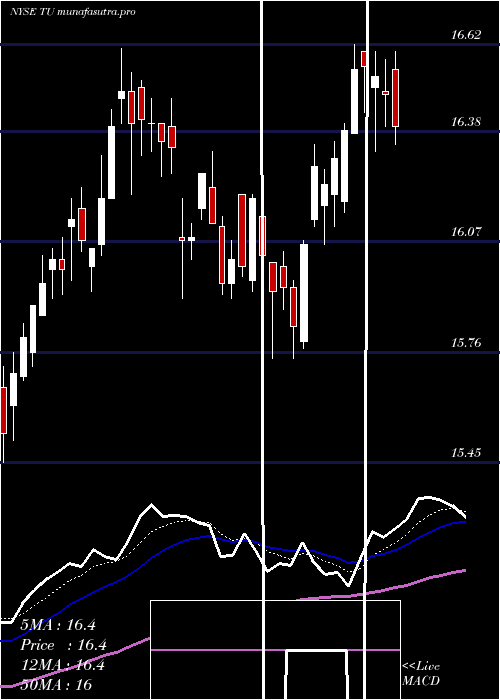
Daily price and charts and targets TelusCorporation Strong Daily Stock price targets for TelusCorporation TU are 14.89 and 15.25 | Daily Target 1 | 14.82 | | Daily Target 2 | 14.95 | | Daily Target 3 | 15.18 | | Daily Target 4 | 15.31 | | Daily Target 5 | 15.54 |
Daily price and volume Telus Corporation
| Date |
Closing |
Open |
Range |
Volume |
Mon 20 October 2025 |
15.08 (-1.63%) |
15.37 |
15.05 - 15.41 |
0.8588 times |
Fri 17 October 2025 |
15.33 (1.66%) |
15.14 |
15.02 - 15.40 |
1.1678 times |
Thu 16 October 2025 |
15.08 (0%) |
15.05 |
15.03 - 15.13 |
1.0913 times |
Wed 15 October 2025 |
15.08 (-0.33%) |
15.16 |
15.02 - 15.30 |
0.8318 times |
Tue 14 October 2025 |
15.13 (-0.59%) |
15.26 |
14.85 - 15.26 |
1.6929 times |
Mon 13 October 2025 |
15.22 (-0.13%) |
15.24 |
15.13 - 15.32 |
0.6756 times |
Fri 10 October 2025 |
15.24 (0.46%) |
15.25 |
15.16 - 15.29 |
1.0762 times |
Thu 09 October 2025 |
15.17 (0.07%) |
15.14 |
15.14 - 15.25 |
0.716 times |
Wed 08 October 2025 |
15.16 (-2.38%) |
15.53 |
15.15 - 15.55 |
1.0161 times |
Tue 07 October 2025 |
15.53 (0%) |
15.52 |
15.45 - 15.58 |
0.8735 times |
Mon 06 October 2025 |
15.53 (-1.02%) |
15.59 |
15.38 - 15.63 |
0.559 times |
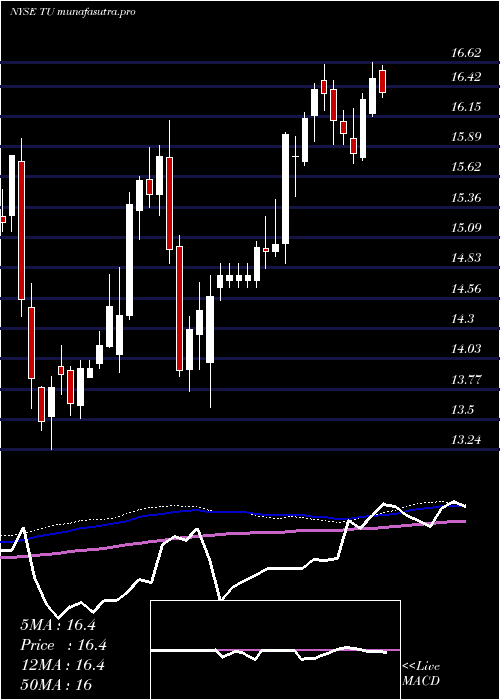
Weekly price and charts TelusCorporation Strong weekly Stock price targets for TelusCorporation TU are 14.89 and 15.25 | Weekly Target 1 | 14.82 | | Weekly Target 2 | 14.95 | | Weekly Target 3 | 15.18 | | Weekly Target 4 | 15.31 | | Weekly Target 5 | 15.54 |
Weekly price and volumes for Telus Corporation
| Date |
Closing |
Open |
Range |
Volume |
Mon 20 October 2025 |
15.08 (-1.63%) |
15.37 |
15.05 - 15.41 |
0.275 times |
Fri 17 October 2025 |
15.33 (0.59%) |
15.24 |
14.85 - 15.40 |
1.7482 times |
Fri 10 October 2025 |
15.24 (-2.87%) |
15.59 |
15.14 - 15.63 |
1.358 times |
Fri 03 October 2025 |
15.69 (0.06%) |
15.72 |
15.54 - 15.88 |
0.9899 times |
Fri 26 September 2025 |
15.68 (-1.38%) |
15.89 |
15.61 - 15.92 |
0.9823 times |
Fri 19 September 2025 |
15.90 (-0.31%) |
15.99 |
15.71 - 16.12 |
1.4356 times |
Fri 12 September 2025 |
15.95 (-3.74%) |
16.61 |
15.80 - 16.65 |
1.161 times |
Fri 05 September 2025 |
16.57 (0.49%) |
16.45 |
16.26 - 16.61 |
0.8996 times |
Fri 29 August 2025 |
16.49 (0%) |
16.47 |
16.34 - 16.55 |
0.177 times |
Fri 29 August 2025 |
16.49 (-0.66%) |
16.62 |
16.34 - 16.65 |
0.9736 times |
Fri 22 August 2025 |
16.60 (1.34%) |
16.37 |
16.37 - 16.72 |
0.8145 times |
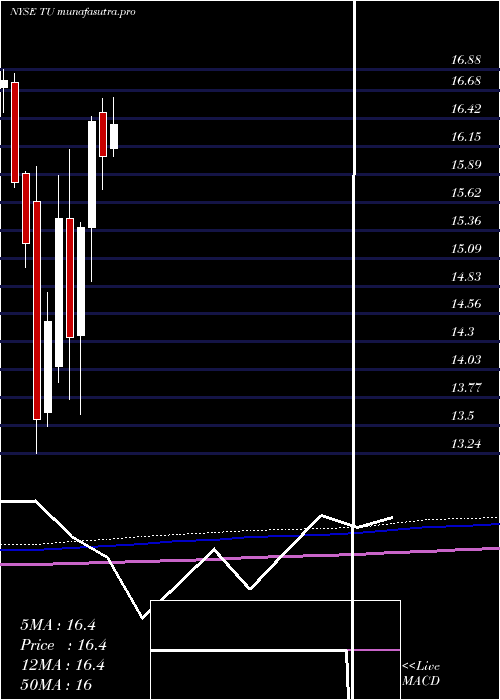
Monthly price and charts TelusCorporation Strong monthly Stock price targets for TelusCorporation TU are 14.45 and 15.48 | Monthly Target 1 | 14.24 | | Monthly Target 2 | 14.66 | | Monthly Target 3 | 15.27 | | Monthly Target 4 | 15.69 | | Monthly Target 5 | 16.3 |
Monthly price and volumes Telus Corporation
| Date |
Closing |
Open |
Range |
Volume |
Mon 20 October 2025 |
15.08 (-4.38%) |
15.75 |
14.85 - 15.88 |
0.8769 times |
Tue 30 September 2025 |
15.77 (-4.37%) |
16.45 |
15.61 - 16.65 |
1.0999 times |
Fri 29 August 2025 |
16.49 (2.42%) |
16.23 |
15.60 - 16.72 |
0.9146 times |
Thu 31 July 2025 |
16.10 (0.25%) |
16.13 |
16.06 - 16.74 |
0.9953 times |
Mon 30 June 2025 |
16.06 (-2.01%) |
16.47 |
15.74 - 16.61 |
0.8218 times |
Fri 30 May 2025 |
16.39 (6.57%) |
15.38 |
14.87 - 16.44 |
0.8923 times |
Wed 30 April 2025 |
15.38 (7.25%) |
14.36 |
13.61 - 15.43 |
1.0889 times |
Mon 31 March 2025 |
14.34 (-7.3%) |
15.47 |
13.75 - 16.12 |
1.0644 times |
Fri 28 February 2025 |
15.47 (6.76%) |
14.07 |
13.91 - 15.88 |
1.0352 times |
Fri 31 January 2025 |
14.49 (6.86%) |
13.63 |
13.50 - 14.77 |
1.2107 times |
Tue 31 December 2024 |
13.56 (-10.97%) |
15.63 |
13.24 - 15.96 |
0.9136 times |
DMA SMA EMA moving averages of Telus Corporation TU
DMA (daily moving average) of Telus Corporation TU
| DMA period | DMA value | | 5 day DMA | 15.14 | | 12 day DMA | 15.27 | | 20 day DMA | 15.46 | | 35 day DMA | 15.74 | | 50 day DMA | 15.95 | | 100 day DMA | 16.09 | | 150 day DMA | 15.72 | | 200 day DMA | 15.48 | EMA (exponential moving average) of Telus Corporation TU
| EMA period | EMA current | EMA prev | EMA prev2 | | 5 day EMA | 15.17 | 15.21 | 15.15 | | 12 day EMA | 15.29 | 15.33 | 15.33 | | 20 day EMA | 15.42 | 15.46 | 15.47 | | 35 day EMA | 15.64 | 15.67 | 15.69 | | 50 day EMA | 15.87 | 15.9 | 15.92 |
SMA (simple moving average) of Telus Corporation TU
| SMA period | SMA current | SMA prev | SMA prev2 | | 5 day SMA | 15.14 | 15.17 | 15.15 | | 12 day SMA | 15.27 | 15.31 | 15.35 | | 20 day SMA | 15.46 | 15.49 | 15.52 | | 35 day SMA | 15.74 | 15.78 | 15.82 | | 50 day SMA | 15.95 | 15.97 | 15.98 | | 100 day SMA | 16.09 | 16.1 | 16.11 | | 150 day SMA | 15.72 | 15.72 | 15.72 | | 200 day SMA | 15.48 | 15.47 | 15.46 |
|
|
