TetraTechnologies TTI full analysis,charts,indicators,moving averages,SMA,DMA,EMA,ADX,MACD,RSITetra Technologies TTI WideScreen charts, DMA,SMA,EMA technical analysis, forecast prediction, by indicators ADX,MACD,RSI,CCI NYSE stock exchange
operates under Energy sector & deals in Oil Gas Production
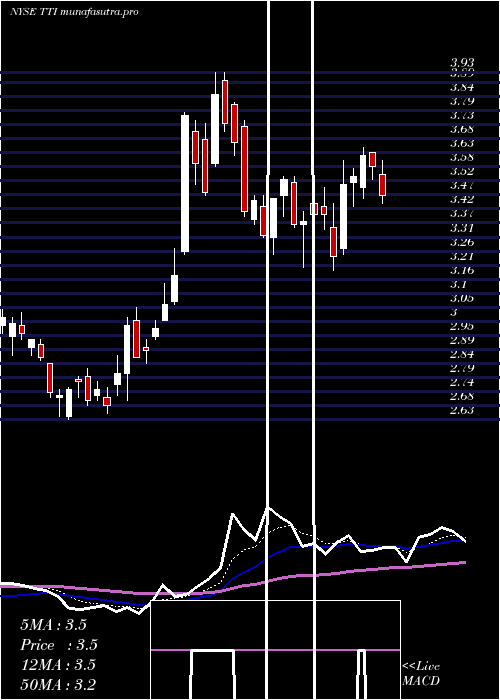
Daily price and charts and targets TetraTechnologies Strong Daily Stock price targets for TetraTechnologies TTI are 8.66 and 9.19 | Daily Target 1 | 8.24 | | Daily Target 2 | 8.54 | | Daily Target 3 | 8.77 | | Daily Target 4 | 9.07 | | Daily Target 5 | 9.3 |
Daily price and volume Tetra Technologies
| Date |
Closing |
Open |
Range |
Volume |
Thu 04 December 2025 |
8.84 (2.2%) |
8.65 |
8.47 - 9.00 |
1.6434 times |
Wed 03 December 2025 |
8.65 (10.47%) |
7.92 |
7.85 - 8.77 |
2.4406 times |
Tue 02 December 2025 |
7.83 (1.56%) |
7.84 |
7.62 - 7.95 |
0.5237 times |
Mon 01 December 2025 |
7.71 (-0.77%) |
7.72 |
7.65 - 8.10 |
0.585 times |
Fri 28 November 2025 |
7.77 (-0.77%) |
7.85 |
7.71 - 7.97 |
0.3741 times |
Wed 26 November 2025 |
7.83 (4.4%) |
7.58 |
7.46 - 7.87 |
0.4487 times |
Tue 25 November 2025 |
7.50 (-2.22%) |
7.62 |
7.14 - 7.68 |
0.7072 times |
Mon 24 November 2025 |
7.67 (3.37%) |
7.42 |
7.26 - 7.77 |
1.6174 times |
Fri 21 November 2025 |
7.42 (3.49%) |
7.17 |
7.05 - 7.47 |
0.6056 times |
Thu 20 November 2025 |
7.17 (-4.14%) |
7.71 |
7.14 - 7.89 |
1.0542 times |
Wed 19 November 2025 |
7.48 (-2.6%) |
7.52 |
7.48 - 7.81 |
0.6934 times |
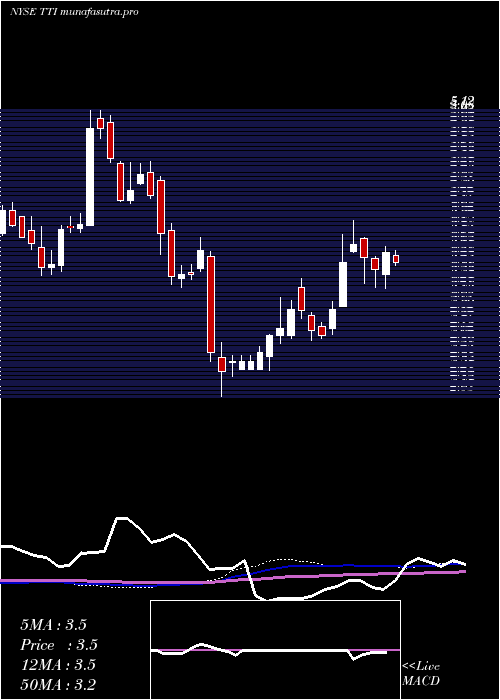
Weekly price and charts TetraTechnologies Strong weekly Stock price targets for TetraTechnologies TTI are 8.23 and 9.61 | Weekly Target 1 | 7.11 | | Weekly Target 2 | 7.97 | | Weekly Target 3 | 8.4866666666667 | | Weekly Target 4 | 9.35 | | Weekly Target 5 | 9.87 |
Weekly price and volumes for Tetra Technologies
| Date |
Closing |
Open |
Range |
Volume |
Thu 04 December 2025 |
8.84 (13.77%) |
7.72 |
7.62 - 9.00 |
0.9867 times |
Fri 28 November 2025 |
7.77 (4.72%) |
7.42 |
7.14 - 7.97 |
0.5981 times |
Fri 21 November 2025 |
7.42 (-3.64%) |
7.70 |
7.05 - 8.06 |
0.6701 times |
Fri 14 November 2025 |
7.70 (1.85%) |
7.64 |
7.21 - 8.35 |
0.8091 times |
Fri 07 November 2025 |
7.56 (7.08%) |
6.96 |
6.75 - 7.87 |
0.6315 times |
Fri 31 October 2025 |
7.06 (0%) |
7.02 |
6.83 - 7.10 |
0.2114 times |
Fri 31 October 2025 |
7.06 (-9.95%) |
7.76 |
6.70 - 7.99 |
1.6983 times |
Fri 24 October 2025 |
7.84 (9.65%) |
7.21 |
7.12 - 8.19 |
1.4012 times |
Fri 17 October 2025 |
7.15 (28.83%) |
5.68 |
5.68 - 7.78 |
2.5462 times |
Tue 07 October 2025 |
5.55 (0.18%) |
5.63 |
5.53 - 5.88 |
0.4473 times |
Fri 03 October 2025 |
5.54 (-5.94%) |
5.98 |
5.38 - 6.00 |
0.695 times |
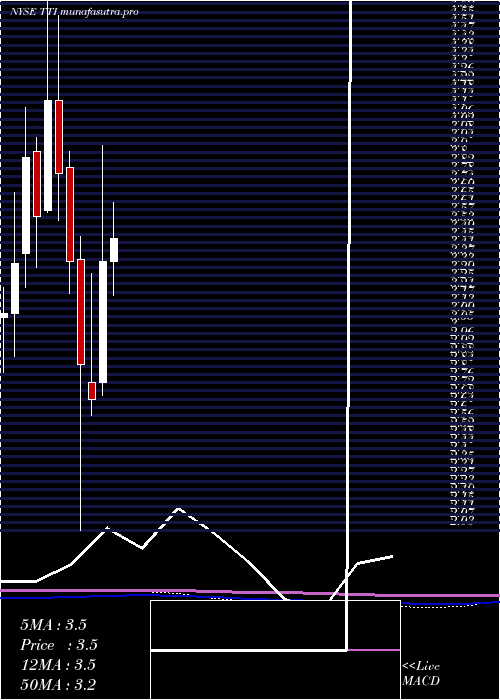
Monthly price and charts TetraTechnologies Strong monthly Stock price targets for TetraTechnologies TTI are 8.23 and 9.61 | Monthly Target 1 | 7.11 | | Monthly Target 2 | 7.97 | | Monthly Target 3 | 8.4866666666667 | | Monthly Target 4 | 9.35 | | Monthly Target 5 | 9.87 |
Monthly price and volumes Tetra Technologies
| Date |
Closing |
Open |
Range |
Volume |
Thu 04 December 2025 |
8.84 (13.77%) |
7.72 |
7.62 - 9.00 |
0.3423 times |
Fri 28 November 2025 |
7.77 (10.06%) |
6.96 |
6.75 - 8.35 |
0.9396 times |
Fri 31 October 2025 |
7.06 (22.78%) |
5.75 |
5.38 - 8.19 |
2.3322 times |
Tue 30 September 2025 |
5.75 (22.34%) |
4.68 |
4.61 - 6.04 |
0.8572 times |
Fri 29 August 2025 |
4.70 (14.63%) |
4.07 |
3.82 - 4.78 |
0.9847 times |
Thu 31 July 2025 |
4.10 (22.02%) |
3.36 |
3.17 - 4.54 |
1.0818 times |
Mon 30 June 2025 |
3.36 (25.37%) |
2.76 |
2.70 - 3.93 |
1.1177 times |
Fri 30 May 2025 |
2.68 (-5.96%) |
2.76 |
2.60 - 3.30 |
0.8113 times |
Wed 30 April 2025 |
2.85 (-15.18%) |
3.37 |
2.03 - 3.48 |
1.0622 times |
Mon 31 March 2025 |
3.36 (-11.35%) |
3.82 |
3.20 - 3.90 |
0.471 times |
Fri 28 February 2025 |
3.79 (-8.67%) |
4.15 |
3.56 - 4.57 |
0.5599 times |
DMA SMA EMA moving averages of Tetra Technologies TTI
DMA (daily moving average) of Tetra Technologies TTI
| DMA period | DMA value | | 5 day DMA | 8.16 | | 12 day DMA | 7.8 | | 20 day DMA | 7.76 | | 35 day DMA | 7.59 | | 50 day DMA | 7.09 | | 100 day DMA | 5.65 | | 150 day DMA | 4.8 | | 200 day DMA | 4.41 | EMA (exponential moving average) of Tetra Technologies TTI
| EMA period | EMA current | EMA prev | EMA prev2 | | 5 day EMA | 8.31 | 8.04 | 7.73 | | 12 day EMA | 7.96 | 7.8 | 7.65 | | 20 day EMA | 7.76 | 7.65 | 7.54 | | 35 day EMA | 7.39 | 7.3 | 7.22 | | 50 day EMA | 7.04 | 6.97 | 6.9 |
SMA (simple moving average) of Tetra Technologies TTI
| SMA period | SMA current | SMA prev | SMA prev2 | | 5 day SMA | 8.16 | 7.96 | 7.73 | | 12 day SMA | 7.8 | 7.69 | 7.61 | | 20 day SMA | 7.76 | 7.68 | 7.6 | | 35 day SMA | 7.59 | 7.56 | 7.51 | | 50 day SMA | 7.09 | 7.02 | 6.96 | | 100 day SMA | 5.65 | 5.6 | 5.55 | | 150 day SMA | 4.8 | 4.76 | 4.72 | | 200 day SMA | 4.41 | 4.38 | 4.36 |
|
|
