TraneTechnologies TT full analysis,charts,indicators,moving averages,SMA,DMA,EMA,ADX,MACD,RSITrane Technologies TT WideScreen charts, DMA,SMA,EMA technical analysis, forecast prediction, by indicators ADX,MACD,RSI,CCI NYSE stock exchange
Daily price and charts and targets TraneTechnologies Strong Daily Stock price targets for TraneTechnologies TT are 400.77 and 408.13 | Daily Target 1 | 399.24 | | Daily Target 2 | 402.3 | | Daily Target 3 | 406.60333333333 | | Daily Target 4 | 409.66 | | Daily Target 5 | 413.96 |
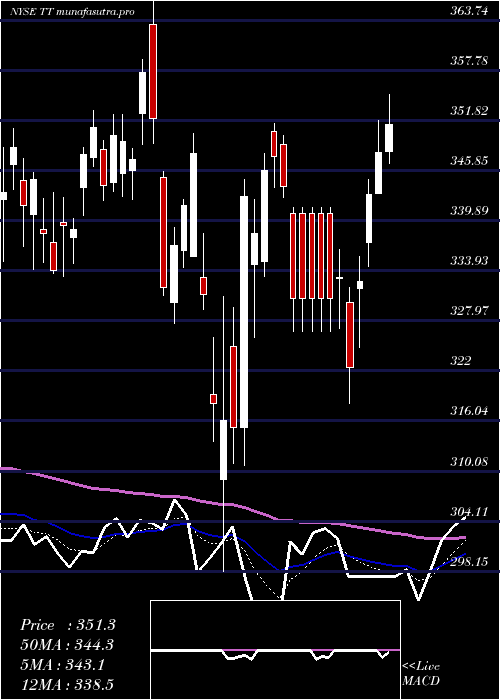
Daily price and volume Trane Technologies
| Date |
Closing |
Open |
Range |
Volume |
Thu 04 December 2025 |
405.35 (-0.91%) |
406.27 |
403.55 - 410.91 |
0.8416 times |
Wed 03 December 2025 |
409.07 (-0.52%) |
409.86 |
403.64 - 411.05 |
0.9679 times |
Tue 02 December 2025 |
411.22 (0.26%) |
412.99 |
406.78 - 414.45 |
1.0373 times |
Mon 01 December 2025 |
410.16 (-2.69%) |
417.52 |
409.91 - 418.84 |
1.3391 times |
Fri 28 November 2025 |
421.48 (0.44%) |
420.91 |
417.44 - 421.99 |
0.3386 times |
Wed 26 November 2025 |
419.64 (0.2%) |
417.83 |
417.24 - 422.86 |
0.7854 times |
Tue 25 November 2025 |
418.82 (2.17%) |
411.66 |
409.09 - 419.47 |
1.0488 times |
Mon 24 November 2025 |
409.94 (-0.04%) |
410.65 |
408.33 - 414.92 |
1.6077 times |
Fri 21 November 2025 |
410.10 (2.51%) |
402.69 |
398.67 - 411.35 |
1.1291 times |
Thu 20 November 2025 |
400.06 (-1.66%) |
413.97 |
399.31 - 415.67 |
0.9044 times |
Wed 19 November 2025 |
406.83 (-0.05%) |
408.69 |
405.39 - 412.27 |
0.7596 times |
Weekly price and charts TraneTechnologies Strong weekly Stock price targets for TraneTechnologies TT are 396.81 and 412.1 | Weekly Target 1 | 393.96 | | Weekly Target 2 | 399.65 | | Weekly Target 3 | 409.24666666667 | | Weekly Target 4 | 414.94 | | Weekly Target 5 | 424.54 |
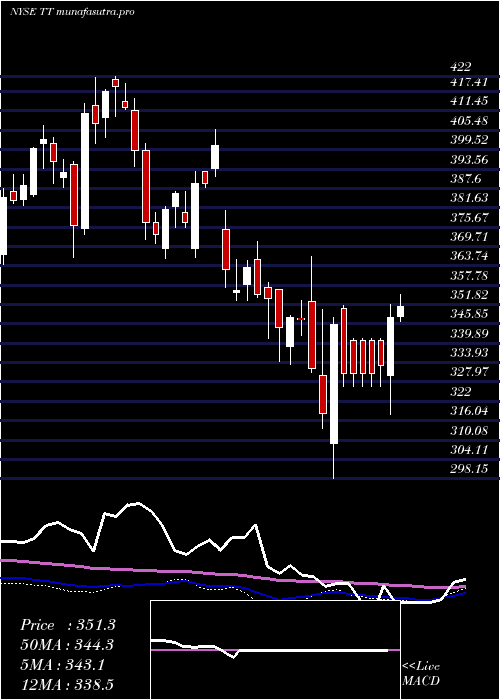
Weekly price and volumes for Trane Technologies
| Date |
Closing |
Open |
Range |
Volume |
Thu 04 December 2025 |
405.35 (-3.83%) |
417.52 |
403.55 - 418.84 |
0.927 times |
Fri 28 November 2025 |
421.48 (2.77%) |
410.65 |
408.33 - 422.86 |
0.8372 times |
Fri 21 November 2025 |
410.10 (-1.93%) |
417.30 |
398.67 - 419.42 |
0.9816 times |
Fri 14 November 2025 |
418.16 (-3.76%) |
434.48 |
408.22 - 438.12 |
1.233 times |
Fri 07 November 2025 |
434.50 (-3.15%) |
442.00 |
425.00 - 443.27 |
0.7935 times |
Fri 31 October 2025 |
448.65 (0%) |
444.89 |
444.89 - 453.38 |
0.4211 times |
Fri 31 October 2025 |
448.65 (5.35%) |
429.17 |
418.38 - 458.65 |
1.6638 times |
Fri 24 October 2025 |
425.87 (2.42%) |
418.28 |
408.11 - 428.52 |
1.1914 times |
Fri 17 October 2025 |
415.82 (0.41%) |
419.14 |
411.40 - 430.83 |
1.0512 times |
Fri 10 October 2025 |
414.14 (-2.35%) |
426.00 |
413.97 - 430.23 |
0.9 times |
Fri 03 October 2025 |
424.09 (2.13%) |
418.86 |
412.51 - 429.21 |
1.0536 times |
Monthly price and charts TraneTechnologies Strong monthly Stock price targets for TraneTechnologies TT are 396.81 and 412.1 | Monthly Target 1 | 393.96 | | Monthly Target 2 | 399.65 | | Monthly Target 3 | 409.24666666667 | | Monthly Target 4 | 414.94 | | Monthly Target 5 | 424.54 |
Monthly price and volumes Trane Technologies
| Date |
Closing |
Open |
Range |
Volume |
Thu 04 December 2025 |
405.35 (-3.83%) |
417.52 |
403.55 - 418.84 |
0.1931 times |
Fri 28 November 2025 |
421.48 (-6.06%) |
442.00 |
398.67 - 443.27 |
0.8012 times |
Fri 31 October 2025 |
448.65 (6.33%) |
418.74 |
408.11 - 458.65 |
1.2067 times |
Tue 30 September 2025 |
421.96 (1.53%) |
410.03 |
394.39 - 423.65 |
1.191 times |
Fri 29 August 2025 |
415.60 (-5.13%) |
432.68 |
413.78 - 441.30 |
0.8838 times |
Thu 31 July 2025 |
438.08 (0.15%) |
434.20 |
424.06 - 476.19 |
1.1061 times |
Mon 30 June 2025 |
437.41 (1.66%) |
427.52 |
416.82 - 438.15 |
0.9221 times |
Fri 30 May 2025 |
430.27 (12.25%) |
387.24 |
386.41 - 436.61 |
1.1664 times |
Wed 30 April 2025 |
383.31 (13.77%) |
336.35 |
298.15 - 384.33 |
1.2526 times |
Mon 31 March 2025 |
336.92 (-4.74%) |
356.38 |
327.67 - 366.52 |
1.2769 times |
Fri 28 February 2025 |
353.70 (-2.49%) |
355.57 |
341.32 - 371.18 |
1.2038 times |

DMA SMA EMA moving averages of Trane Technologies TT
DMA (daily moving average) of Trane Technologies TT
| DMA period | DMA value | | 5 day DMA | 411.46 | | 12 day DMA | 410.81 | | 20 day DMA | 416.17 | | 35 day DMA | 421.23 | | 50 day DMA | 420.92 | | 100 day DMA | 423.71 | | 150 day DMA | 424.19 | | 200 day DMA | 403.73 | EMA (exponential moving average) of Trane Technologies TT
| EMA period | EMA current | EMA prev | EMA prev2 | | 5 day EMA | 409.83 | 412.07 | 413.57 | | 12 day EMA | 412.8 | 414.15 | 415.07 | | 20 day EMA | 415.32 | 416.37 | 417.14 | | 35 day EMA | 416.56 | 417.22 | 417.7 | | 50 day EMA | 418.66 | 419.2 | 419.61 |
SMA (simple moving average) of Trane Technologies TT
| SMA period | SMA current | SMA prev | SMA prev2 | | 5 day SMA | 411.46 | 414.31 | 416.26 | | 12 day SMA | 410.81 | 411.51 | 412.27 | | 20 day SMA | 416.17 | 417.72 | 418.91 | | 35 day SMA | 421.23 | 421.72 | 422.14 | | 50 day SMA | 420.92 | 420.9 | 420.82 | | 100 day SMA | 423.71 | 424.02 | 424.32 | | 150 day SMA | 424.19 | 424.04 | 423.67 | | 200 day SMA | 403.73 | 403.56 | 403.33 |
|
|
