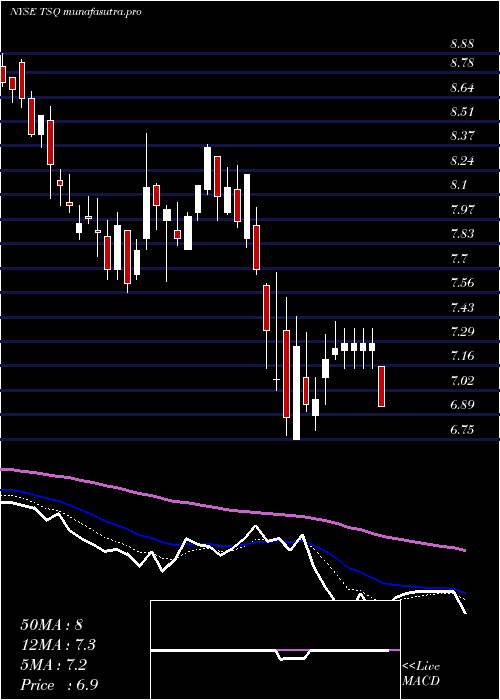
TownsquareMedia TSQ full analysis,charts,indicators,moving averages,SMA,DMA,EMA,ADX,MACD,RSITownsquare Media TSQ WideScreen charts, DMA,SMA,EMA technical analysis, forecast prediction, by indicators ADX,MACD,RSI,CCI NYSE stock exchange
operates under Consumer Services sector & deals in Broadcasting
Daily price and charts and targets TownsquareMedia Strong Daily Stock price targets for TownsquareMedia TSQ are 6.29 and 6.55 | Daily Target 1 | 6.1 | | Daily Target 2 | 6.22 | | Daily Target 3 | 6.3566666666667 | | Daily Target 4 | 6.48 | | Daily Target 5 | 6.62 |
Daily price and volume Townsquare Media
| Date |
Closing |
Open |
Range |
Volume |
Mon 20 October 2025 |
6.35 (3.08%) |
6.23 |
6.23 - 6.49 |
1.1676 times |
Fri 17 October 2025 |
6.16 (0.82%) |
6.09 |
6.09 - 6.23 |
1.3752 times |
Thu 16 October 2025 |
6.11 (-2.24%) |
6.25 |
6.11 - 6.32 |
0.4702 times |
Wed 15 October 2025 |
6.25 (0%) |
6.26 |
6.20 - 6.44 |
0.5802 times |
Tue 14 October 2025 |
6.25 (2.63%) |
6.14 |
6.12 - 6.39 |
1.5863 times |
Mon 13 October 2025 |
6.09 (-2.72%) |
6.27 |
6.07 - 6.33 |
1.2847 times |
Tue 07 October 2025 |
6.26 (-6.15%) |
6.49 |
6.23 - 6.51 |
1.4284 times |
Mon 06 October 2025 |
6.67 (3.09%) |
6.47 |
6.42 - 6.67 |
0.8991 times |
Fri 03 October 2025 |
6.47 (-0.77%) |
6.52 |
6.47 - 6.68 |
0.8837 times |
Thu 02 October 2025 |
6.52 (-1.66%) |
6.66 |
6.51 - 6.68 |
0.3246 times |
Wed 01 October 2025 |
6.63 (-1.34%) |
6.68 |
6.58 - 6.79 |
1.1853 times |
Weekly price and charts TownsquareMedia Strong weekly Stock price targets for TownsquareMedia TSQ are 6.29 and 6.55 | Weekly Target 1 | 6.1 | | Weekly Target 2 | 6.22 | | Weekly Target 3 | 6.3566666666667 | | Weekly Target 4 | 6.48 | | Weekly Target 5 | 6.62 |
Weekly price and volumes for Townsquare Media
| Date |
Closing |
Open |
Range |
Volume |
Mon 20 October 2025 |
6.35 (3.08%) |
6.23 |
6.23 - 6.49 |
0.3658 times |
Fri 17 October 2025 |
6.16 (-1.6%) |
6.27 |
6.07 - 6.44 |
1.6593 times |
Tue 07 October 2025 |
6.26 (-3.25%) |
6.47 |
6.23 - 6.67 |
0.7292 times |
Fri 03 October 2025 |
6.47 (-4.29%) |
6.80 |
6.47 - 6.90 |
1.0556 times |
Fri 26 September 2025 |
6.76 (-3.7%) |
6.98 |
6.73 - 7.23 |
1.2629 times |
Fri 19 September 2025 |
7.02 (0.14%) |
7.03 |
6.81 - 7.15 |
1.3308 times |
Fri 12 September 2025 |
7.01 (-2.5%) |
7.17 |
6.91 - 7.41 |
1.1184 times |
Fri 05 September 2025 |
7.19 (1.84%) |
7.08 |
7.01 - 7.34 |
1.0117 times |
Fri 29 August 2025 |
7.06 (0%) |
7.01 |
7.00 - 7.19 |
0.2496 times |
Fri 29 August 2025 |
7.06 (2.47%) |
6.87 |
6.75 - 7.19 |
1.2168 times |
Fri 22 August 2025 |
6.89 (-1.85%) |
7.02 |
6.75 - 7.14 |
1.3569 times |

Monthly price and charts TownsquareMedia Strong monthly Stock price targets for TownsquareMedia TSQ are 5.85 and 6.57 | Monthly Target 1 | 5.68 | | Monthly Target 2 | 6.02 | | Monthly Target 3 | 6.4033333333333 | | Monthly Target 4 | 6.74 | | Monthly Target 5 | 7.12 |
Monthly price and volumes Townsquare Media
| Date |
Closing |
Open |
Range |
Volume |
Mon 20 October 2025 |
6.35 (-5.51%) |
6.68 |
6.07 - 6.79 |
0.4125 times |
Tue 30 September 2025 |
6.72 (-4.82%) |
7.08 |
6.69 - 7.41 |
0.5921 times |
Fri 29 August 2025 |
7.06 (2.47%) |
6.87 |
6.55 - 7.24 |
0.8735 times |
Thu 31 July 2025 |
6.89 (-12.9%) |
7.85 |
6.88 - 9.31 |
1.2038 times |
Mon 30 June 2025 |
7.91 (14.64%) |
6.89 |
6.69 - 7.94 |
2.4139 times |
Fri 30 May 2025 |
6.90 (4.23%) |
6.66 |
6.54 - 7.50 |
1.2158 times |
Wed 30 April 2025 |
6.62 (-18.67%) |
8.13 |
6.47 - 8.26 |
0.797 times |
Mon 31 March 2025 |
8.14 (-4.68%) |
8.51 |
7.56 - 8.59 |
0.8465 times |
Fri 28 February 2025 |
8.54 (-3.83%) |
8.76 |
8.36 - 9.38 |
0.5947 times |
Fri 31 January 2025 |
8.88 (-2.31%) |
9.20 |
8.70 - 10.23 |
1.0502 times |
Tue 31 December 2024 |
9.09 (-10.27%) |
10.16 |
8.90 - 10.44 |
0.7908 times |

DMA SMA EMA moving averages of Townsquare Media TSQ
DMA (daily moving average) of Townsquare Media TSQ
| DMA period | DMA value | | 5 day DMA | 6.22 | | 12 day DMA | 6.37 | | 20 day DMA | 6.56 | | 35 day DMA | 6.78 | | 50 day DMA | 6.81 | | 100 day DMA | 7.11 | | 150 day DMA | 7.17 | | 200 day DMA | 7.61 | EMA (exponential moving average) of Townsquare Media TSQ
| EMA period | EMA current | EMA prev | EMA prev2 | | 5 day EMA | 6.26 | 6.21 | 6.24 | | 12 day EMA | 6.37 | 6.37 | 6.41 | | 20 day EMA | 6.49 | 6.51 | 6.55 | | 35 day EMA | 6.62 | 6.64 | 6.67 | | 50 day EMA | 6.76 | 6.78 | 6.81 |
SMA (simple moving average) of Townsquare Media TSQ
| SMA period | SMA current | SMA prev | SMA prev2 | | 5 day SMA | 6.22 | 6.17 | 6.19 | | 12 day SMA | 6.37 | 6.41 | 6.46 | | 20 day SMA | 6.56 | 6.59 | 6.63 | | 35 day SMA | 6.78 | 6.8 | 6.82 | | 50 day SMA | 6.81 | 6.82 | 6.83 | | 100 day SMA | 7.11 | 7.11 | 7.12 | | 150 day SMA | 7.17 | 7.18 | 7.19 | | 200 day SMA | 7.61 | 7.62 | 7.64 |
|
|
