TaiwanSemiconductor TSM full analysis,charts,indicators,moving averages,SMA,DMA,EMA,ADX,MACD,RSITaiwan Semiconductor TSM WideScreen charts, DMA,SMA,EMA technical analysis, forecast prediction, by indicators ADX,MACD,RSI,CCI NYSE stock exchange
operates under Technology sector & deals in Semiconductors
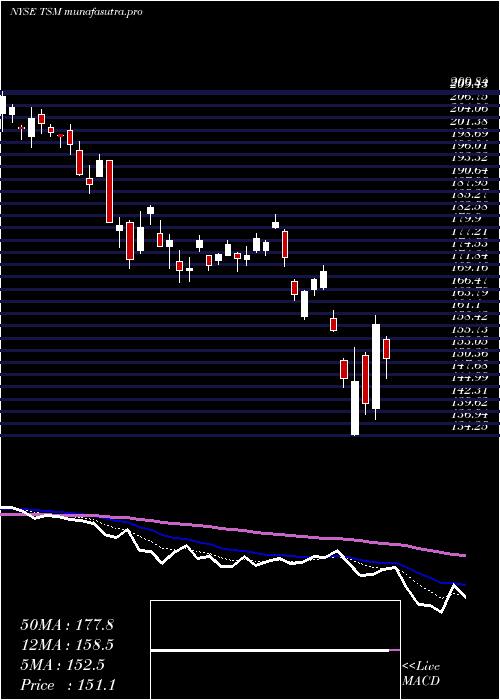
Daily price and charts and targets TaiwanSemiconductor Strong Daily Stock price targets for TaiwanSemiconductor TSM are 290.2 and 297.75 | Daily Target 1 | 288.7 | | Daily Target 2 | 291.69 | | Daily Target 3 | 296.24666666667 | | Daily Target 4 | 299.24 | | Daily Target 5 | 303.8 |
Daily price and volume Taiwan Semiconductor
| Date |
Closing |
Open |
Range |
Volume |
Fri 05 December 2025 |
294.69 (0.61%) |
294.77 |
293.25 - 300.80 |
0.7383 times |
Thu 04 December 2025 |
292.91 (-0.86%) |
292.13 |
290.20 - 294.99 |
0.5328 times |
Wed 03 December 2025 |
295.45 (1.11%) |
292.18 |
286.07 - 296.62 |
1.0692 times |
Tue 02 December 2025 |
292.20 (1.57%) |
288.72 |
288.20 - 294.50 |
0.847 times |
Mon 01 December 2025 |
287.68 (-1.31%) |
286.92 |
283.19 - 291.16 |
0.8585 times |
Fri 28 November 2025 |
291.51 (0.52%) |
292.48 |
289.00 - 292.67 |
0.6143 times |
Wed 26 November 2025 |
290.00 (1.88%) |
285.12 |
285.12 - 292.81 |
0.9724 times |
Tue 25 November 2025 |
284.66 (0.04%) |
283.50 |
273.08 - 285.40 |
1.0403 times |
Mon 24 November 2025 |
284.56 (3.45%) |
275.24 |
272.12 - 285.06 |
1.0048 times |
Fri 21 November 2025 |
275.06 (-0.88%) |
272.81 |
266.82 - 278.69 |
2.3224 times |
Thu 20 November 2025 |
277.50 (-1.72%) |
292.21 |
276.41 - 292.85 |
1.7539 times |
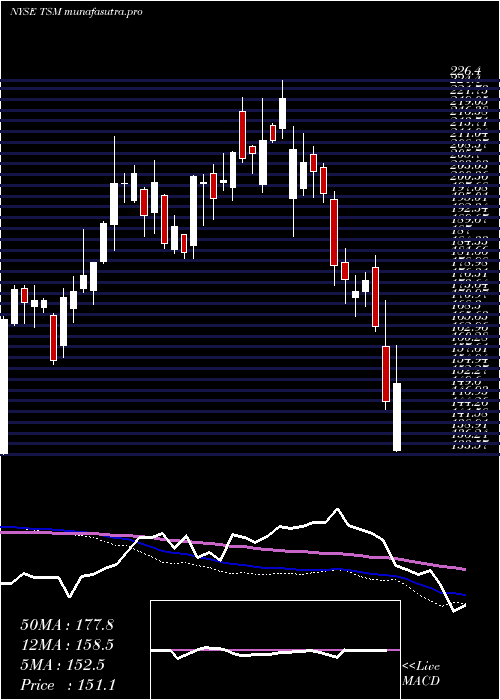
Weekly price and charts TaiwanSemiconductor Strong weekly Stock price targets for TaiwanSemiconductor TSM are 288.94 and 306.55 | Weekly Target 1 | 275.28 | | Weekly Target 2 | 284.99 | | Weekly Target 3 | 292.89333333333 | | Weekly Target 4 | 302.6 | | Weekly Target 5 | 310.5 |
Weekly price and volumes for Taiwan Semiconductor
| Date |
Closing |
Open |
Range |
Volume |
Fri 05 December 2025 |
294.69 (1.09%) |
286.92 |
283.19 - 300.80 |
0.7275 times |
Fri 28 November 2025 |
291.51 (5.98%) |
275.24 |
272.12 - 292.81 |
0.6531 times |
Fri 21 November 2025 |
275.06 (-3.43%) |
281.44 |
266.82 - 292.85 |
1.3331 times |
Fri 14 November 2025 |
284.82 (-0.61%) |
294.36 |
273.23 - 297.13 |
0.955 times |
Fri 07 November 2025 |
286.58 (-4.61%) |
301.90 |
277.13 - 302.19 |
0.7836 times |
Fri 31 October 2025 |
300.43 (0%) |
305.99 |
296.68 - 307.68 |
0.2537 times |
Fri 31 October 2025 |
300.43 (1.84%) |
298.65 |
293.69 - 307.96 |
1.3768 times |
Fri 24 October 2025 |
295.00 (-0.44%) |
302.50 |
284.40 - 303.65 |
0.7773 times |
Fri 17 October 2025 |
296.30 (5.57%) |
298.23 |
290.20 - 317.00 |
1.7408 times |
Fri 10 October 2025 |
280.66 (-3.94%) |
295.12 |
280.33 - 307.30 |
1.399 times |
Fri 03 October 2025 |
292.17 (6.88%) |
276.49 |
273.23 - 296.82 |
0.8892 times |
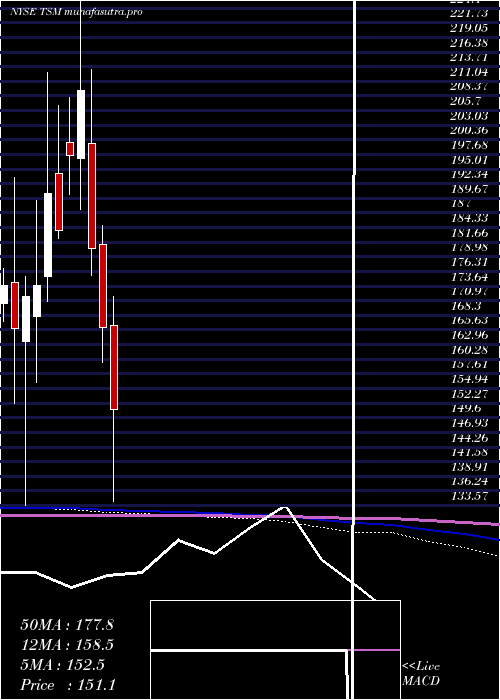
Monthly price and charts TaiwanSemiconductor Strong monthly Stock price targets for TaiwanSemiconductor TSM are 288.94 and 306.55 | Monthly Target 1 | 275.28 | | Monthly Target 2 | 284.99 | | Monthly Target 3 | 292.89333333333 | | Monthly Target 4 | 302.6 | | Monthly Target 5 | 310.5 |
Monthly price and volumes Taiwan Semiconductor
| Date |
Closing |
Open |
Range |
Volume |
Fri 05 December 2025 |
294.69 (1.09%) |
286.92 |
283.19 - 300.80 |
0.1457 times |
Fri 28 November 2025 |
291.51 (-2.97%) |
301.90 |
266.82 - 302.19 |
0.7458 times |
Fri 31 October 2025 |
300.43 (7.57%) |
278.43 |
277.17 - 317.00 |
1.2231 times |
Tue 30 September 2025 |
279.29 (20.97%) |
226.15 |
225.63 - 286.00 |
1.0066 times |
Fri 29 August 2025 |
230.87 (-4.45%) |
235.62 |
223.70 - 247.84 |
0.9171 times |
Thu 31 July 2025 |
241.62 (6.68%) |
227.43 |
221.18 - 248.28 |
1.0558 times |
Mon 30 June 2025 |
226.49 (17.16%) |
193.04 |
192.20 - 228.88 |
0.8213 times |
Fri 30 May 2025 |
193.32 (15.98%) |
172.80 |
170.59 - 199.80 |
1.1287 times |
Wed 30 April 2025 |
166.69 (0.42%) |
166.39 |
134.25 - 171.75 |
1.7039 times |
Mon 31 March 2025 |
166.00 (-8.05%) |
181.15 |
159.73 - 184.74 |
1.252 times |
Fri 28 February 2025 |
180.53 (-13.75%) |
199.63 |
175.52 - 213.18 |
1.1258 times |
DMA SMA EMA moving averages of Taiwan Semiconductor TSM
DMA (daily moving average) of Taiwan Semiconductor TSM
| DMA period | DMA value | | 5 day DMA | 292.59 | | 12 day DMA | 287.38 | | 20 day DMA | 286.96 | | 35 day DMA | 291.11 | | 50 day DMA | 291.37 | | 100 day DMA | 268.4 | | 150 day DMA | 247.91 | | 200 day DMA | 228.03 | EMA (exponential moving average) of Taiwan Semiconductor TSM
| EMA period | EMA current | EMA prev | EMA prev2 | | 5 day EMA | 292.69 | 291.69 | 291.08 | | 12 day EMA | 289.98 | 289.12 | 288.43 | | 20 day EMA | 289.32 | 288.75 | 288.31 | | 35 day EMA | 288.99 | 288.65 | 288.4 | | 50 day EMA | 290.21 | 290.03 | 289.91 |
SMA (simple moving average) of Taiwan Semiconductor TSM
| SMA period | SMA current | SMA prev | SMA prev2 | | 5 day SMA | 292.59 | 291.95 | 291.37 | | 12 day SMA | 287.38 | 285.99 | 285.08 | | 20 day SMA | 286.96 | 286.69 | 286.75 | | 35 day SMA | 291.11 | 291.21 | 291.55 | | 50 day SMA | 291.37 | 291.01 | 290.76 | | 100 day SMA | 268.4 | 267.82 | 267.26 | | 150 day SMA | 247.91 | 247.1 | 246.26 | | 200 day SMA | 228.03 | 227.56 | 227.11 |
|
|
