TcwStrategic TSI full analysis,charts,indicators,moving averages,SMA,DMA,EMA,ADX,MACD,RSITcw Strategic TSI WideScreen charts, DMA,SMA,EMA technical analysis, forecast prediction, by indicators ADX,MACD,RSI,CCI NYSE stock exchange
operates under N A sector & deals in N A
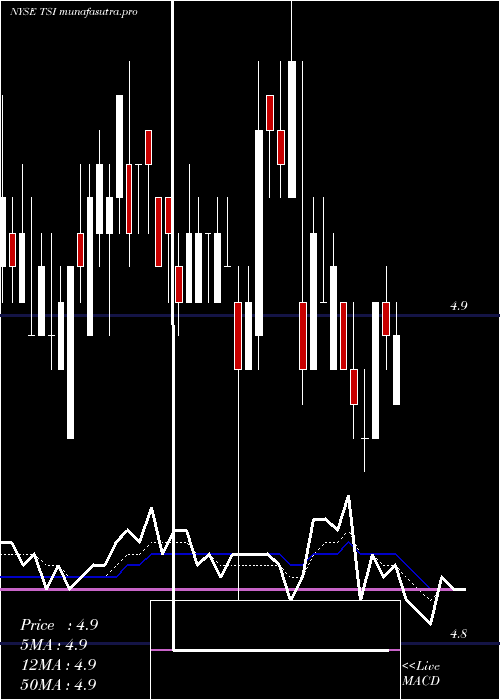
Daily price and charts and targets TcwStrategic Strong Daily Stock price targets for TcwStrategic TSI are 4.9 and 4.92 | Daily Target 1 | 4.9 | | Daily Target 2 | 4.9 | | Daily Target 3 | 4.9166666666667 | | Daily Target 4 | 4.92 | | Daily Target 5 | 4.94 |
Daily price and volume Tcw Strategic
| Date |
Closing |
Open |
Range |
Volume |
Thu 04 December 2025 |
4.91 (-0.2%) |
4.91 |
4.91 - 4.93 |
0.8393 times |
Wed 03 December 2025 |
4.92 (0%) |
4.91 |
4.91 - 4.94 |
0.573 times |
Tue 02 December 2025 |
4.92 (0.2%) |
4.91 |
4.91 - 4.93 |
0.6384 times |
Mon 01 December 2025 |
4.91 (-0.41%) |
4.90 |
4.90 - 4.93 |
0.9903 times |
Fri 28 November 2025 |
4.93 (0%) |
4.91 |
4.91 - 4.94 |
0.3145 times |
Wed 26 November 2025 |
4.93 (-0.4%) |
4.92 |
4.88 - 4.95 |
0.8362 times |
Tue 25 November 2025 |
4.95 (1.23%) |
4.87 |
4.87 - 4.95 |
3.2903 times |
Mon 24 November 2025 |
4.89 (0.62%) |
4.86 |
4.86 - 4.89 |
0.9748 times |
Fri 21 November 2025 |
4.86 (0%) |
4.86 |
4.86 - 4.89 |
0.9078 times |
Thu 20 November 2025 |
4.86 (-0.61%) |
4.88 |
4.86 - 4.89 |
0.6353 times |
Wed 19 November 2025 |
4.89 (-0.2%) |
4.91 |
4.88 - 4.91 |
0.3223 times |
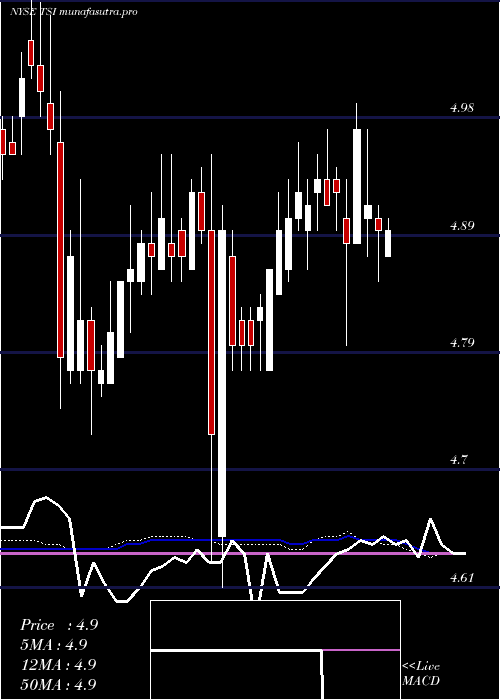
Weekly price and charts TcwStrategic Strong weekly Stock price targets for TcwStrategic TSI are 4.91 and 4.95 | Weekly Target 1 | 4.88 | | Weekly Target 2 | 4.89 | | Weekly Target 3 | 4.9166666666667 | | Weekly Target 4 | 4.93 | | Weekly Target 5 | 4.96 |
Weekly price and volumes for Tcw Strategic
| Date |
Closing |
Open |
Range |
Volume |
Thu 04 December 2025 |
4.91 (-0.41%) |
4.90 |
4.90 - 4.94 |
0.6547 times |
Fri 28 November 2025 |
4.93 (1.44%) |
4.86 |
4.86 - 4.95 |
1.1659 times |
Fri 21 November 2025 |
4.86 (-1.02%) |
4.91 |
4.86 - 4.93 |
0.9916 times |
Fri 14 November 2025 |
4.91 (0%) |
4.91 |
4.90 - 4.96 |
1.8793 times |
Fri 07 November 2025 |
4.91 (-0.2%) |
4.90 |
4.83 - 4.95 |
1.178 times |
Fri 31 October 2025 |
4.92 (0%) |
4.89 |
4.89 - 4.94 |
0.1532 times |
Fri 31 October 2025 |
4.92 (0%) |
4.91 |
4.88 - 4.94 |
1.1958 times |
Fri 24 October 2025 |
4.92 (0.41%) |
4.89 |
4.89 - 4.96 |
1.243 times |
Fri 17 October 2025 |
4.90 (-0.81%) |
4.95 |
4.88 - 4.95 |
1.1659 times |
Tue 07 October 2025 |
4.94 (0.2%) |
4.92 |
4.91 - 4.96 |
0.3725 times |
Fri 03 October 2025 |
4.93 (-1.79%) |
4.99 |
4.91 - 5.00 |
0.8166 times |
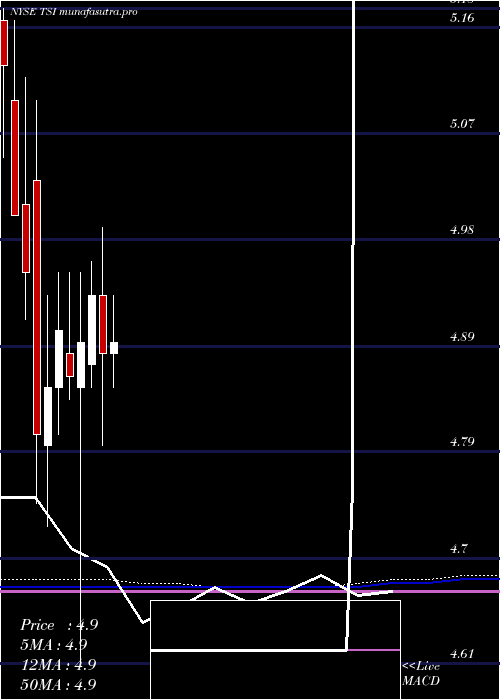
Monthly price and charts TcwStrategic Strong monthly Stock price targets for TcwStrategic TSI are 4.91 and 4.95 | Monthly Target 1 | 4.88 | | Monthly Target 2 | 4.89 | | Monthly Target 3 | 4.9166666666667 | | Monthly Target 4 | 4.93 | | Monthly Target 5 | 4.96 |
Monthly price and volumes Tcw Strategic
| Date |
Closing |
Open |
Range |
Volume |
Thu 04 December 2025 |
4.91 (-0.41%) |
4.90 |
4.90 - 4.94 |
0.1567 times |
Fri 28 November 2025 |
4.93 (0.2%) |
4.90 |
4.83 - 4.96 |
1.2482 times |
Fri 31 October 2025 |
4.92 (0%) |
4.92 |
4.88 - 4.96 |
1.0822 times |
Tue 30 September 2025 |
4.92 (-0.81%) |
4.93 |
4.91 - 5.06 |
1.0274 times |
Fri 29 August 2025 |
4.96 (0.81%) |
4.90 |
4.86 - 4.96 |
1.0356 times |
Thu 31 July 2025 |
4.92 (0.82%) |
4.88 |
4.85 - 4.93 |
1.0157 times |
Mon 30 June 2025 |
4.88 (-1.01%) |
4.93 |
4.80 - 4.99 |
1.5469 times |
Fri 30 May 2025 |
4.93 (0.82%) |
4.87 |
4.85 - 4.96 |
0.6654 times |
Wed 30 April 2025 |
4.89 (0.62%) |
4.85 |
4.61 - 4.95 |
1.2333 times |
Mon 31 March 2025 |
4.86 (-0.82%) |
4.88 |
4.84 - 4.95 |
0.9887 times |
Fri 28 February 2025 |
4.90 (1.03%) |
4.85 |
4.81 - 4.95 |
1.194 times |
DMA SMA EMA moving averages of Tcw Strategic TSI
DMA (daily moving average) of Tcw Strategic TSI
| DMA period | DMA value | | 5 day DMA | 4.92 | | 12 day DMA | 4.91 | | 20 day DMA | 4.91 | | 35 day DMA | 4.91 | | 50 day DMA | 4.93 | | 100 day DMA | 4.93 | | 150 day DMA | 4.92 | | 200 day DMA | 4.91 | EMA (exponential moving average) of Tcw Strategic TSI
| EMA period | EMA current | EMA prev | EMA prev2 | | 5 day EMA | 4.92 | 4.92 | 4.92 | | 12 day EMA | 4.91 | 4.91 | 4.91 | | 20 day EMA | 4.92 | 4.92 | 4.92 | | 35 day EMA | 4.94 | 4.94 | 4.94 | | 50 day EMA | 4.94 | 4.94 | 4.94 |
SMA (simple moving average) of Tcw Strategic TSI
| SMA period | SMA current | SMA prev | SMA prev2 | | 5 day SMA | 4.92 | 4.92 | 4.93 | | 12 day SMA | 4.91 | 4.91 | 4.9 | | 20 day SMA | 4.91 | 4.91 | 4.91 | | 35 day SMA | 4.91 | 4.91 | 4.91 | | 50 day SMA | 4.93 | 4.93 | 4.93 | | 100 day SMA | 4.93 | 4.93 | 4.93 | | 150 day SMA | 4.92 | 4.92 | 4.92 | | 200 day SMA | 4.91 | 4.91 | 4.91 |
|
|
