TrinityIndustries TRN full analysis,charts,indicators,moving averages,SMA,DMA,EMA,ADX,MACD,RSITrinity Industries TRN WideScreen charts, DMA,SMA,EMA technical analysis, forecast prediction, by indicators ADX,MACD,RSI,CCI NYSE stock exchange
operates under Capital Goods sector & deals in Railroads
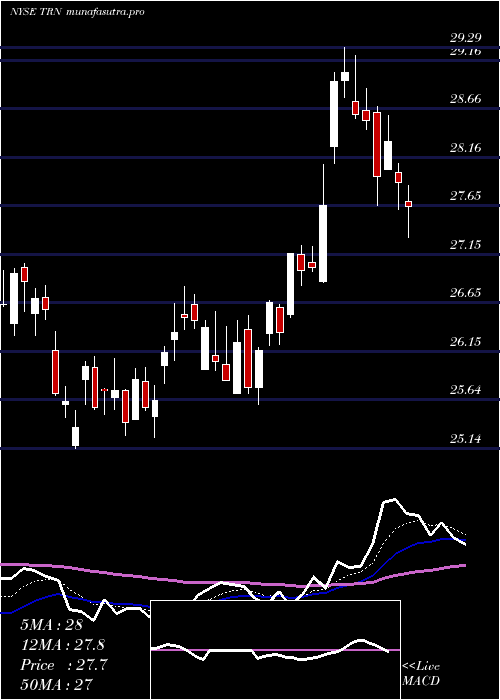
Daily price and charts and targets TrinityIndustries Strong Daily Stock price targets for TrinityIndustries TRN are 28.18 and 28.55 | Daily Target 1 | 27.88 | | Daily Target 2 | 28.11 | | Daily Target 3 | 28.25 | | Daily Target 4 | 28.48 | | Daily Target 5 | 28.62 |
Daily price and volume Trinity Industries
| Date |
Closing |
Open |
Range |
Volume |
Mon 20 October 2025 |
28.34 (1.54%) |
28.08 |
28.02 - 28.39 |
0.7764 times |
Fri 17 October 2025 |
27.91 (-0.46%) |
27.95 |
27.76 - 28.12 |
1.0611 times |
Thu 16 October 2025 |
28.04 (-0.5%) |
28.23 |
27.85 - 28.42 |
0.9009 times |
Wed 15 October 2025 |
28.18 (0.25%) |
27.93 |
27.85 - 28.47 |
0.9175 times |
Tue 14 October 2025 |
28.11 (1.88%) |
27.25 |
27.25 - 28.28 |
1.0461 times |
Mon 13 October 2025 |
27.59 (1.62%) |
27.47 |
27.37 - 27.78 |
0.8841 times |
Fri 10 October 2025 |
27.15 (-2.37%) |
27.93 |
27.05 - 28.00 |
1.1593 times |
Thu 09 October 2025 |
27.81 (-0.93%) |
28.17 |
27.64 - 28.17 |
0.9682 times |
Wed 08 October 2025 |
28.07 (1.85%) |
27.70 |
27.54 - 28.16 |
0.9631 times |
Tue 07 October 2025 |
27.56 (-1.43%) |
27.89 |
27.44 - 27.92 |
1.3232 times |
Mon 06 October 2025 |
27.96 (-0.43%) |
28.18 |
27.87 - 28.35 |
0.8095 times |
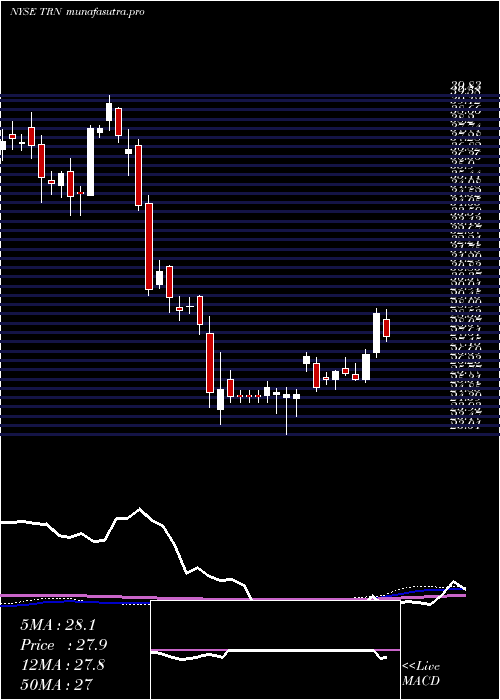
Weekly price and charts TrinityIndustries Strong weekly Stock price targets for TrinityIndustries TRN are 28.18 and 28.55 | Weekly Target 1 | 27.88 | | Weekly Target 2 | 28.11 | | Weekly Target 3 | 28.25 | | Weekly Target 4 | 28.48 | | Weekly Target 5 | 28.62 |
Weekly price and volumes for Trinity Industries
| Date |
Closing |
Open |
Range |
Volume |
Mon 20 October 2025 |
28.34 (1.54%) |
28.08 |
28.02 - 28.39 |
0.1532 times |
Fri 17 October 2025 |
27.91 (2.8%) |
27.47 |
27.25 - 28.47 |
0.9489 times |
Fri 10 October 2025 |
27.15 (-3.31%) |
28.18 |
27.05 - 28.35 |
1.0305 times |
Fri 03 October 2025 |
28.08 (0.14%) |
28.12 |
27.57 - 28.40 |
0.9231 times |
Fri 26 September 2025 |
28.04 (-0.04%) |
28.01 |
27.51 - 28.79 |
1.0602 times |
Fri 19 September 2025 |
28.05 (-0.36%) |
28.31 |
27.60 - 28.71 |
2.0583 times |
Fri 12 September 2025 |
28.15 (-1.47%) |
28.63 |
27.87 - 28.83 |
1.1978 times |
Fri 05 September 2025 |
28.57 (0.53%) |
28.11 |
27.72 - 28.92 |
1.0762 times |
Fri 29 August 2025 |
28.42 (0%) |
28.59 |
28.16 - 28.72 |
0.2773 times |
Fri 29 August 2025 |
28.42 (-2%) |
28.85 |
28.16 - 29.01 |
1.2746 times |
Fri 22 August 2025 |
29.00 (5.8%) |
27.54 |
27.51 - 29.27 |
1.4043 times |
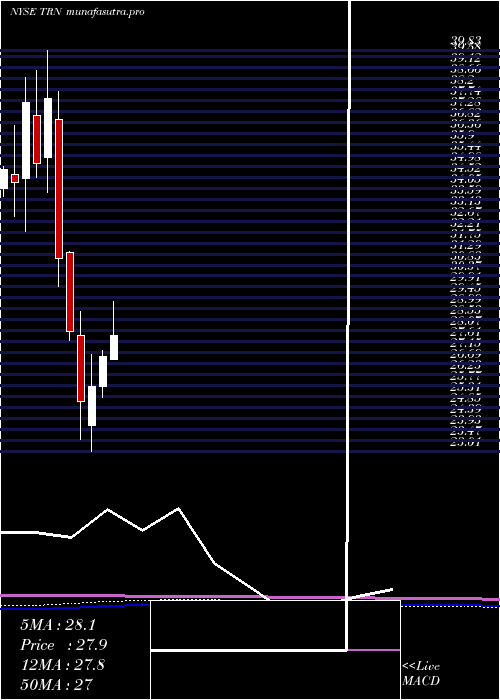
Monthly price and charts TrinityIndustries Strong monthly Stock price targets for TrinityIndustries TRN are 27.7 and 29.12 | Monthly Target 1 | 26.53 | | Monthly Target 2 | 27.44 | | Monthly Target 3 | 27.953333333333 | | Monthly Target 4 | 28.86 | | Monthly Target 5 | 29.37 |
Monthly price and volumes Trinity Industries
| Date |
Closing |
Open |
Range |
Volume |
Mon 20 October 2025 |
28.34 (1.07%) |
27.82 |
27.05 - 28.47 |
0.4222 times |
Tue 30 September 2025 |
28.04 (-1.34%) |
28.11 |
27.51 - 28.92 |
0.9287 times |
Fri 29 August 2025 |
28.42 (21.97%) |
23.04 |
22.91 - 29.27 |
1.3818 times |
Thu 31 July 2025 |
23.30 (-13.74%) |
26.87 |
22.38 - 29.29 |
1.3188 times |
Mon 30 June 2025 |
27.01 (4.93%) |
25.74 |
25.25 - 27.24 |
1.0437 times |
Fri 30 May 2025 |
25.74 (2.55%) |
24.09 |
23.01 - 27.07 |
0.853 times |
Wed 30 April 2025 |
25.10 (-10.55%) |
27.89 |
23.50 - 28.88 |
1.1201 times |
Mon 31 March 2025 |
28.06 (-9.75%) |
31.35 |
27.67 - 31.41 |
1.0044 times |
Fri 28 February 2025 |
31.09 (-17.82%) |
36.94 |
29.92 - 38.14 |
0.9954 times |
Fri 31 January 2025 |
37.83 (7.78%) |
35.37 |
33.90 - 39.83 |
0.932 times |
Tue 31 December 2024 |
35.10 (-6.85%) |
37.11 |
34.50 - 39.00 |
0.7086 times |
DMA SMA EMA moving averages of Trinity Industries TRN
DMA (daily moving average) of Trinity Industries TRN
| DMA period | DMA value | | 5 day DMA | 28.12 | | 12 day DMA | 27.9 | | 20 day DMA | 27.91 | | 35 day DMA | 28.05 | | 50 day DMA | 28.13 | | 100 day DMA | 27.35 | | 150 day DMA | 26.94 | | 200 day DMA | 28.82 | EMA (exponential moving average) of Trinity Industries TRN
| EMA period | EMA current | EMA prev | EMA prev2 | | 5 day EMA | 28.07 | 27.94 | 27.95 | | 12 day EMA | 27.97 | 27.9 | 27.9 | | 20 day EMA | 27.96 | 27.92 | 27.92 | | 35 day EMA | 27.98 | 27.96 | 27.96 | | 50 day EMA | 28.04 | 28.03 | 28.04 |
SMA (simple moving average) of Trinity Industries TRN
| SMA period | SMA current | SMA prev | SMA prev2 | | 5 day SMA | 28.12 | 27.97 | 27.81 | | 12 day SMA | 27.9 | 27.85 | 27.84 | | 20 day SMA | 27.91 | 27.9 | 27.91 | | 35 day SMA | 28.05 | 28.06 | 28.07 | | 50 day SMA | 28.13 | 28.12 | 28.11 | | 100 day SMA | 27.35 | 27.33 | 27.3 | | 150 day SMA | 26.94 | 26.95 | 26.96 | | 200 day SMA | 28.82 | 28.85 | 28.89 |
|
|
