TutorPerini TPC full analysis,charts,indicators,moving averages,SMA,DMA,EMA,ADX,MACD,RSITutor Perini TPC WideScreen charts, DMA,SMA,EMA technical analysis, forecast prediction, by indicators ADX,MACD,RSI,CCI NYSE stock exchange
operates under Basic Industries sector & deals in General Bldg Contractors Nonresidential Bldgs
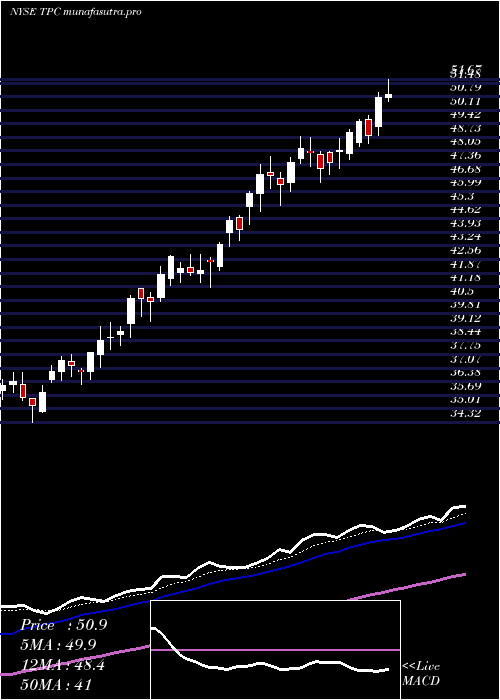
Daily price and charts and targets TutorPerini Strong Daily Stock price targets for TutorPerini TPC are 66.64 and 68.25 | Daily Target 1 | 66.25 | | Daily Target 2 | 67.03 | | Daily Target 3 | 67.856666666667 | | Daily Target 4 | 68.64 | | Daily Target 5 | 69.47 |
Daily price and volume Tutor Perini
| Date |
Closing |
Open |
Range |
Volume |
Fri 05 December 2025 |
67.82 (-1.19%) |
68.68 |
67.07 - 68.68 |
1.295 times |
Thu 04 December 2025 |
68.64 (1.49%) |
66.64 |
66.64 - 69.35 |
0.9653 times |
Wed 03 December 2025 |
67.63 (1.79%) |
66.67 |
64.65 - 67.93 |
1.1432 times |
Tue 02 December 2025 |
66.44 (0.02%) |
66.70 |
66.02 - 67.94 |
0.4105 times |
Mon 01 December 2025 |
66.43 (-3.09%) |
66.97 |
65.84 - 67.57 |
0.9212 times |
Fri 28 November 2025 |
68.55 (1.47%) |
67.49 |
67.13 - 68.74 |
0.6444 times |
Wed 26 November 2025 |
67.56 (3.67%) |
67.01 |
66.17 - 68.25 |
1.3063 times |
Tue 25 November 2025 |
65.17 (1.81%) |
64.02 |
62.96 - 65.46 |
0.6729 times |
Mon 24 November 2025 |
64.01 (5.04%) |
61.37 |
60.94 - 64.46 |
1.2703 times |
Fri 21 November 2025 |
60.94 (1.99%) |
60.22 |
58.11 - 61.46 |
1.3709 times |
Thu 20 November 2025 |
59.75 (-0.6%) |
62.68 |
59.35 - 63.60 |
1.916 times |
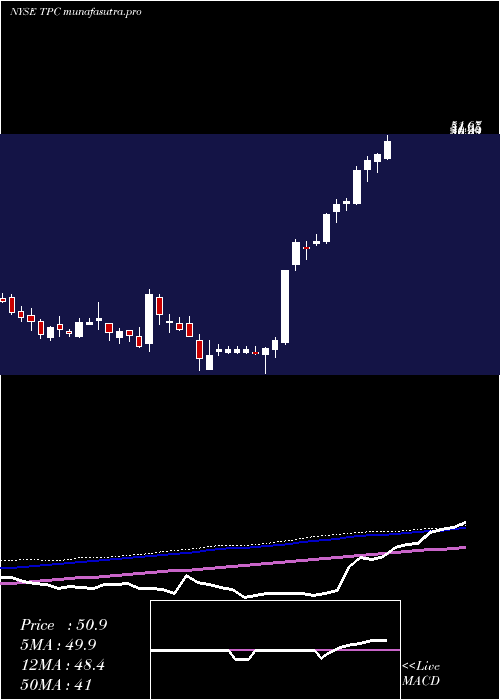
Weekly price and charts TutorPerini Strong weekly Stock price targets for TutorPerini TPC are 66.24 and 70.94 | Weekly Target 1 | 62.57 | | Weekly Target 2 | 65.2 | | Weekly Target 3 | 67.273333333333 | | Weekly Target 4 | 69.9 | | Weekly Target 5 | 71.97 |
Weekly price and volumes for Tutor Perini
| Date |
Closing |
Open |
Range |
Volume |
Fri 05 December 2025 |
67.82 (-1.06%) |
66.97 |
64.65 - 69.35 |
0.8677 times |
Fri 28 November 2025 |
68.55 (12.49%) |
61.37 |
60.94 - 68.74 |
0.7135 times |
Fri 21 November 2025 |
60.94 (3.15%) |
59.56 |
57.90 - 63.60 |
1.3143 times |
Fri 14 November 2025 |
59.08 (-6.13%) |
64.46 |
58.48 - 65.20 |
1.2102 times |
Fri 07 November 2025 |
62.94 (-6.56%) |
66.18 |
62.18 - 77.00 |
1.3859 times |
Fri 31 October 2025 |
67.36 (0%) |
67.56 |
66.23 - 69.44 |
0.1888 times |
Fri 31 October 2025 |
67.36 (-2.15%) |
69.62 |
66.23 - 70.45 |
0.9551 times |
Fri 24 October 2025 |
68.84 (7.19%) |
65.57 |
62.00 - 71.07 |
1.4187 times |
Fri 17 October 2025 |
64.22 (4.24%) |
62.07 |
60.42 - 65.07 |
1.5723 times |
Tue 07 October 2025 |
61.61 (-1.28%) |
62.98 |
61.00 - 64.10 |
0.3735 times |
Fri 03 October 2025 |
62.41 (-3.49%) |
65.20 |
60.82 - 65.96 |
1.168 times |
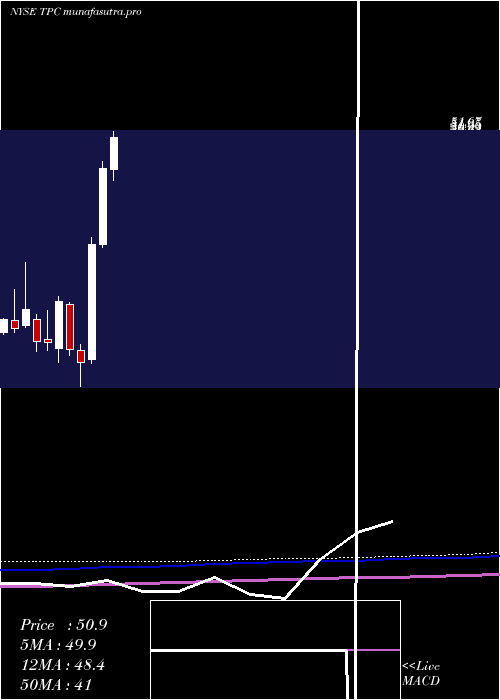
Monthly price and charts TutorPerini Strong monthly Stock price targets for TutorPerini TPC are 66.24 and 70.94 | Monthly Target 1 | 62.57 | | Monthly Target 2 | 65.2 | | Monthly Target 3 | 67.273333333333 | | Monthly Target 4 | 69.9 | | Monthly Target 5 | 71.97 |
Monthly price and volumes Tutor Perini
| Date |
Closing |
Open |
Range |
Volume |
Fri 05 December 2025 |
67.82 (-1.06%) |
66.97 |
64.65 - 69.35 |
0.1537 times |
Fri 28 November 2025 |
68.55 (1.77%) |
66.18 |
57.90 - 77.00 |
0.8192 times |
Fri 31 October 2025 |
67.36 (2.7%) |
64.83 |
60.42 - 71.07 |
0.9226 times |
Tue 30 September 2025 |
65.59 (11.28%) |
57.35 |
56.62 - 68.09 |
0.9815 times |
Fri 29 August 2025 |
58.94 (22.41%) |
46.42 |
43.52 - 63.96 |
1.3363 times |
Thu 31 July 2025 |
48.15 (2.93%) |
46.67 |
45.27 - 51.98 |
1.2083 times |
Mon 30 June 2025 |
46.78 (26.84%) |
36.90 |
36.50 - 47.76 |
1.2984 times |
Fri 30 May 2025 |
36.88 (71.85%) |
21.89 |
21.40 - 37.77 |
1.3058 times |
Wed 30 April 2025 |
21.46 (-7.42%) |
23.06 |
18.34 - 23.83 |
1.0485 times |
Mon 31 March 2025 |
23.18 (-21.13%) |
29.04 |
22.36 - 29.35 |
0.9257 times |
Fri 28 February 2025 |
29.39 (22%) |
23.35 |
21.46 - 30.04 |
0.8964 times |
DMA SMA EMA moving averages of Tutor Perini TPC
DMA (daily moving average) of Tutor Perini TPC
| DMA period | DMA value | | 5 day DMA | 67.39 | | 12 day DMA | 65.25 | | 20 day DMA | 63.64 | | 35 day DMA | 65.19 | | 50 day DMA | 64.77 | | 100 day DMA | 60.44 | | 150 day DMA | 53.02 | | 200 day DMA | 45.59 | EMA (exponential moving average) of Tutor Perini TPC
| EMA period | EMA current | EMA prev | EMA prev2 | | 5 day EMA | 67.48 | 67.31 | 66.64 | | 12 day EMA | 66.03 | 65.71 | 65.18 | | 20 day EMA | 65.34 | 65.08 | 64.71 | | 35 day EMA | 64.78 | 64.6 | 64.36 | | 50 day EMA | 65.07 | 64.96 | 64.81 |
SMA (simple moving average) of Tutor Perini TPC
| SMA period | SMA current | SMA prev | SMA prev2 | | 5 day SMA | 67.39 | 67.54 | 67.32 | | 12 day SMA | 65.25 | 64.64 | 63.82 | | 20 day SMA | 63.64 | 63.62 | 63.58 | | 35 day SMA | 65.19 | 65.09 | 64.93 | | 50 day SMA | 64.77 | 64.75 | 64.69 | | 100 day SMA | 60.44 | 60.25 | 60.04 | | 150 day SMA | 53.02 | 52.71 | 52.4 | | 200 day SMA | 45.59 | 45.37 | 45.14 |
|
|
