TurningPoint TPB full analysis,charts,indicators,moving averages,SMA,DMA,EMA,ADX,MACD,RSITurning Point TPB WideScreen charts, DMA,SMA,EMA technical analysis, forecast prediction, by indicators ADX,MACD,RSI,CCI NYSE stock exchange
operates under Consumer Non Durables sector & deals in Tobacco
Daily price and charts and targets TurningPoint Strong Daily Stock price targets for TurningPoint TPB are 84.52 and 90.63 | Daily Target 1 | 83.46 | | Daily Target 2 | 85.57 | | Daily Target 3 | 89.57 | | Daily Target 4 | 91.68 | | Daily Target 5 | 95.68 |
Daily price and volume Turning Point
| Date |
Closing |
Open |
Range |
Volume |
Mon 20 October 2025 |
87.68 (-3.43%) |
91.54 |
87.46 - 93.57 |
0.9505 times |
Fri 17 October 2025 |
90.79 (0.31%) |
91.14 |
90.55 - 92.81 |
0.77 times |
Thu 16 October 2025 |
90.51 (-1.11%) |
91.63 |
89.61 - 92.57 |
0.9496 times |
Wed 15 October 2025 |
91.53 (0.51%) |
90.10 |
90.10 - 93.97 |
0.7982 times |
Tue 14 October 2025 |
91.07 (1.47%) |
89.27 |
89.27 - 91.72 |
0.8768 times |
Mon 13 October 2025 |
89.75 (0.12%) |
88.48 |
87.67 - 89.85 |
0.7141 times |
Tue 07 October 2025 |
89.64 (0.36%) |
89.18 |
86.87 - 91.28 |
1.2561 times |
Mon 06 October 2025 |
89.32 (1.03%) |
89.21 |
86.20 - 89.49 |
1.063 times |
Fri 03 October 2025 |
88.41 (-8.56%) |
96.73 |
86.41 - 98.19 |
2.0593 times |
Thu 02 October 2025 |
96.69 (-0.74%) |
96.90 |
95.24 - 99.65 |
0.5626 times |
Wed 01 October 2025 |
97.41 (-1.47%) |
98.23 |
96.21 - 99.78 |
0.772 times |
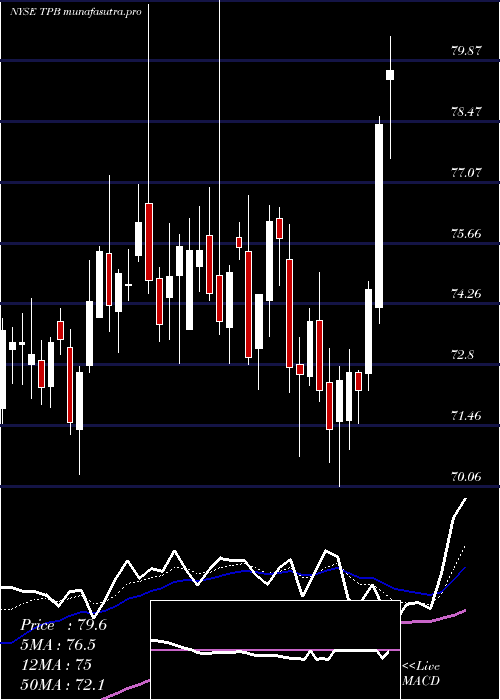
Weekly price and charts TurningPoint Strong weekly Stock price targets for TurningPoint TPB are 84.52 and 90.63 | Weekly Target 1 | 83.46 | | Weekly Target 2 | 85.57 | | Weekly Target 3 | 89.57 | | Weekly Target 4 | 91.68 | | Weekly Target 5 | 95.68 |
Weekly price and volumes for Turning Point
| Date |
Closing |
Open |
Range |
Volume |
Mon 20 October 2025 |
87.68 (-3.43%) |
91.54 |
87.46 - 93.57 |
0.2594 times |
Fri 17 October 2025 |
90.79 (1.28%) |
88.48 |
87.67 - 93.97 |
1.1213 times |
Tue 07 October 2025 |
89.64 (1.39%) |
89.21 |
86.20 - 91.28 |
0.6329 times |
Fri 03 October 2025 |
88.41 (-9.81%) |
97.85 |
86.41 - 100.00 |
1.38 times |
Fri 26 September 2025 |
98.03 (-4.08%) |
102.01 |
94.83 - 104.28 |
1.3612 times |
Fri 19 September 2025 |
102.20 (-0.14%) |
103.00 |
100.47 - 104.76 |
1.6089 times |
Fri 12 September 2025 |
102.34 (1.43%) |
101.56 |
97.12 - 102.77 |
0.8797 times |
Fri 05 September 2025 |
100.90 (1.41%) |
98.22 |
95.60 - 101.40 |
0.8829 times |
Fri 29 August 2025 |
99.50 (0%) |
100.50 |
97.20 - 100.50 |
0.3368 times |
Fri 29 August 2025 |
99.50 (0.6%) |
98.74 |
96.42 - 101.25 |
1.5369 times |
Fri 22 August 2025 |
98.91 (0.33%) |
98.58 |
96.26 - 100.82 |
1.5766 times |
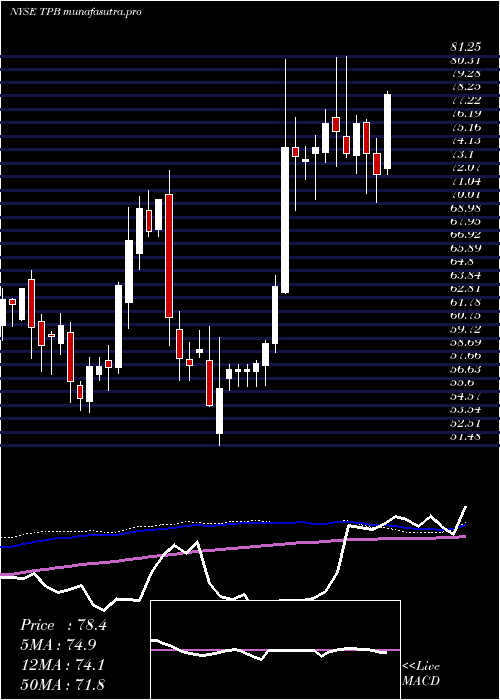
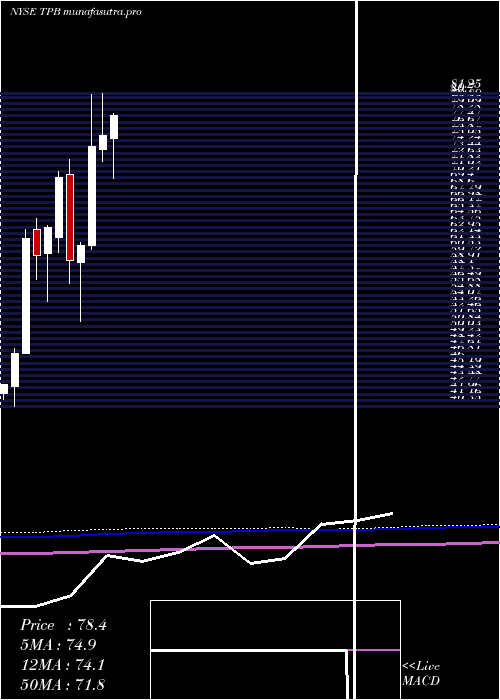
Monthly price and charts TurningPoint Strong monthly Stock price targets for TurningPoint TPB are 80.15 and 93.73 | Monthly Target 1 | 77.64 | | Monthly Target 2 | 82.66 | | Monthly Target 3 | 91.22 | | Monthly Target 4 | 96.24 | | Monthly Target 5 | 104.8 |
Monthly price and volumes Turning Point
| Date |
Closing |
Open |
Range |
Volume |
Mon 20 October 2025 |
87.68 (-11.31%) |
98.23 |
86.20 - 99.78 |
0.6722 times |
Tue 30 September 2025 |
98.86 (-0.64%) |
98.22 |
94.83 - 104.76 |
1.1859 times |
Fri 29 August 2025 |
99.50 (19.97%) |
81.75 |
79.28 - 102.90 |
1.7426 times |
Thu 31 July 2025 |
82.94 (9.46%) |
75.29 |
70.06 - 84.05 |
1.4375 times |
Mon 30 June 2025 |
75.77 (1.95%) |
73.94 |
72.30 - 81.25 |
1.0169 times |
Fri 30 May 2025 |
74.32 (21.08%) |
61.40 |
60.84 - 81.05 |
0.9202 times |
Wed 30 April 2025 |
61.38 (3.26%) |
59.15 |
51.48 - 61.72 |
0.6142 times |
Mon 31 March 2025 |
59.44 (-15.45%) |
70.69 |
56.45 - 72.54 |
0.8507 times |
Fri 28 February 2025 |
70.30 (10.29%) |
62.45 |
60.42 - 70.99 |
0.7907 times |
Fri 31 January 2025 |
63.74 (6.06%) |
60.35 |
54.06 - 64.00 |
0.7689 times |
Tue 31 December 2024 |
60.10 (-3.53%) |
63.48 |
56.96 - 64.87 |
0.5627 times |
DMA SMA EMA moving averages of Turning Point TPB
DMA (daily moving average) of Turning Point TPB
| DMA period | DMA value | | 5 day DMA | 90.32 | | 12 day DMA | 91.81 | | 20 day DMA | 95.04 | | 35 day DMA | 97.21 | | 50 day DMA | 97.48 | | 100 day DMA | 86.76 | | 150 day DMA | 78.45 | | 200 day DMA | 74.5 | EMA (exponential moving average) of Turning Point TPB
| EMA period | EMA current | EMA prev | EMA prev2 | | 5 day EMA | 89.85 | 90.93 | 91 | | 12 day EMA | 91.83 | 92.59 | 92.92 | | 20 day EMA | 93.54 | 94.16 | 94.51 | | 35 day EMA | 94.66 | 95.07 | 95.32 | | 50 day EMA | 95.65 | 95.98 | 96.19 |
SMA (simple moving average) of Turning Point TPB
| SMA period | SMA current | SMA prev | SMA prev2 | | 5 day SMA | 90.32 | 90.73 | 90.5 | | 12 day SMA | 91.81 | 92.56 | 93.16 | | 20 day SMA | 95.04 | 95.75 | 96.34 | | 35 day SMA | 97.21 | 97.52 | 97.75 | | 50 day SMA | 97.48 | 97.58 | 97.38 | | 100 day SMA | 86.76 | 86.61 | 86.44 | | 150 day SMA | 78.45 | 78.26 | 78.05 | | 200 day SMA | 74.5 | 74.36 | 74.2 |
|
|
