TollBrothers TOL full analysis,charts,indicators,moving averages,SMA,DMA,EMA,ADX,MACD,RSIToll Brothers TOL WideScreen charts, DMA,SMA,EMA technical analysis, forecast prediction, by indicators ADX,MACD,RSI,CCI NYSE stock exchange
operates under Capital Goods sector & deals in Homebuilding
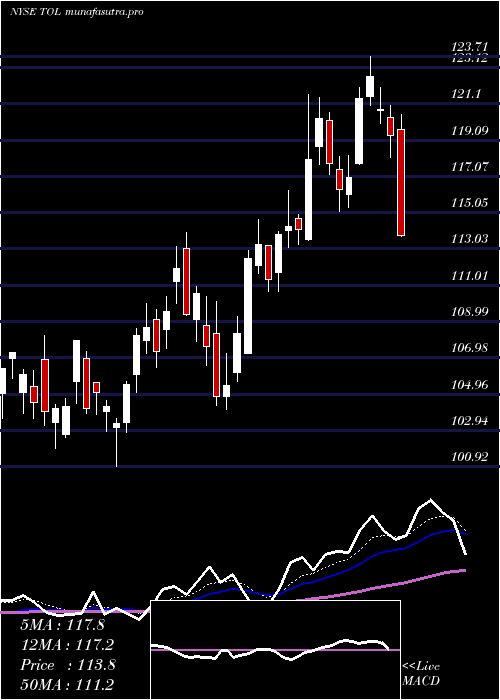
Daily price and charts and targets TollBrothers Strong Daily Stock price targets for TollBrothers TOL are 137.78 and 143.47 | Daily Target 1 | 136.66 | | Daily Target 2 | 138.89 | | Daily Target 3 | 142.35333333333 | | Daily Target 4 | 144.58 | | Daily Target 5 | 148.04 |
Daily price and volume Toll Brothers
| Date |
Closing |
Open |
Range |
Volume |
Thu 04 December 2025 |
141.11 (-1.12%) |
143.65 |
140.13 - 145.82 |
0.6496 times |
Wed 03 December 2025 |
142.71 (2.6%) |
139.50 |
139.50 - 143.55 |
1.2335 times |
Tue 02 December 2025 |
139.10 (-0.56%) |
139.37 |
137.78 - 140.20 |
0.8422 times |
Mon 01 December 2025 |
139.88 (0.04%) |
137.46 |
136.76 - 141.33 |
0.8344 times |
Fri 28 November 2025 |
139.83 (-0.48%) |
140.72 |
139.03 - 140.72 |
0.3755 times |
Wed 26 November 2025 |
140.51 (1.56%) |
137.93 |
137.74 - 141.23 |
1.0138 times |
Tue 25 November 2025 |
138.35 (6.14%) |
131.44 |
131.30 - 138.84 |
1.2959 times |
Mon 24 November 2025 |
130.35 (-0.97%) |
131.63 |
130.07 - 131.63 |
0.9881 times |
Fri 21 November 2025 |
131.63 (4.26%) |
127.26 |
127.26 - 133.04 |
1.5484 times |
Thu 20 November 2025 |
126.25 (-0.08%) |
126.99 |
124.76 - 128.96 |
1.2187 times |
Wed 19 November 2025 |
126.35 (-0.02%) |
127.13 |
125.03 - 127.41 |
0.8635 times |
Weekly price and charts TollBrothers Strong weekly Stock price targets for TollBrothers TOL are 138.94 and 148 | Weekly Target 1 | 132.17 | | Weekly Target 2 | 136.64 | | Weekly Target 3 | 141.23 | | Weekly Target 4 | 145.7 | | Weekly Target 5 | 150.29 |
Weekly price and volumes for Toll Brothers
| Date |
Closing |
Open |
Range |
Volume |
Thu 04 December 2025 |
141.11 (0.92%) |
137.46 |
136.76 - 145.82 |
0.8941 times |
Fri 28 November 2025 |
139.83 (6.23%) |
131.63 |
130.07 - 141.23 |
0.9227 times |
Fri 21 November 2025 |
131.63 (0.99%) |
129.63 |
123.90 - 133.04 |
1.511 times |
Fri 14 November 2025 |
130.34 (-2.57%) |
133.99 |
130.13 - 137.25 |
0.9809 times |
Fri 07 November 2025 |
133.78 (-0.87%) |
131.72 |
131.00 - 135.13 |
0.7162 times |
Fri 31 October 2025 |
134.95 (0%) |
133.01 |
131.23 - 135.16 |
0.1559 times |
Fri 31 October 2025 |
134.95 (-2.15%) |
137.92 |
131.23 - 140.82 |
1.6014 times |
Fri 24 October 2025 |
137.92 (1.63%) |
136.59 |
132.41 - 139.73 |
1.2326 times |
Fri 17 October 2025 |
135.71 (2.15%) |
127.14 |
126.55 - 136.40 |
1.3976 times |
Tue 07 October 2025 |
132.86 (-6.91%) |
143.73 |
132.63 - 143.86 |
0.5877 times |
Fri 03 October 2025 |
142.72 (4.01%) |
138.48 |
136.00 - 143.49 |
1.1025 times |
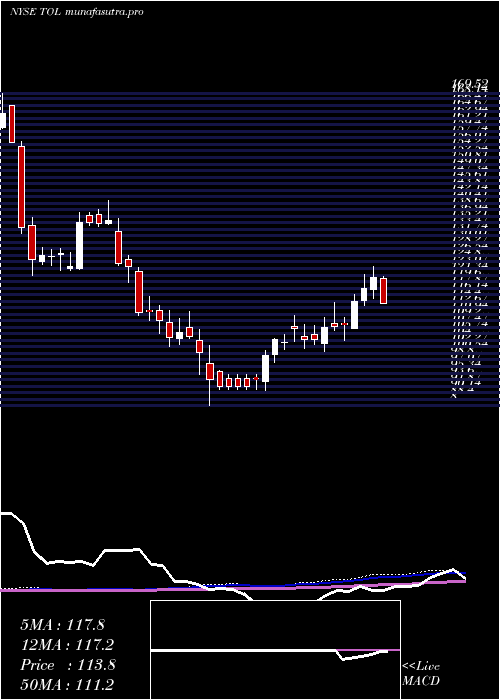
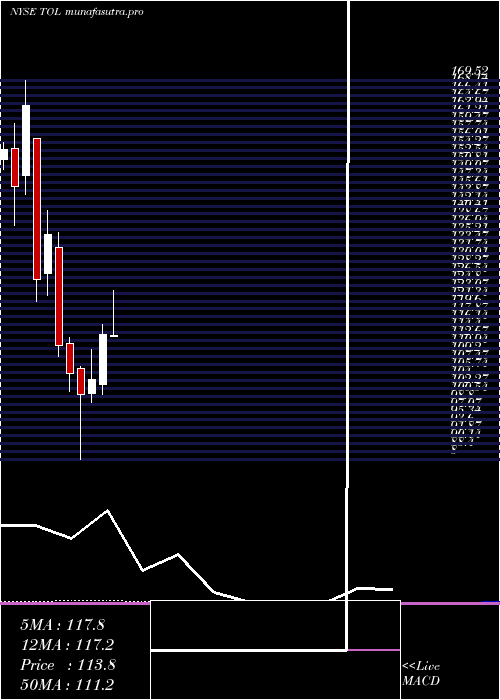
Monthly price and charts TollBrothers Strong monthly Stock price targets for TollBrothers TOL are 138.94 and 148 | Monthly Target 1 | 132.17 | | Monthly Target 2 | 136.64 | | Monthly Target 3 | 141.23 | | Monthly Target 4 | 145.7 | | Monthly Target 5 | 150.29 |
Monthly price and volumes Toll Brothers
| Date |
Closing |
Open |
Range |
Volume |
Thu 04 December 2025 |
141.11 (0.92%) |
137.46 |
136.76 - 145.82 |
0.1223 times |
Fri 28 November 2025 |
139.83 (3.62%) |
131.72 |
123.90 - 141.23 |
0.565 times |
Fri 31 October 2025 |
134.95 (-2.31%) |
138.60 |
126.55 - 143.86 |
0.7658 times |
Tue 30 September 2025 |
138.14 (-0.62%) |
136.17 |
133.82 - 149.79 |
1.1807 times |
Fri 29 August 2025 |
139.00 (17.44%) |
119.91 |
117.71 - 140.86 |
1.1613 times |
Thu 31 July 2025 |
118.36 (3.71%) |
113.53 |
113.52 - 129.06 |
1.2772 times |
Mon 30 June 2025 |
114.13 (9.48%) |
103.10 |
100.92 - 116.28 |
1.1243 times |
Fri 30 May 2025 |
104.25 (3.35%) |
101.08 |
99.12 - 110.67 |
1.2443 times |
Wed 30 April 2025 |
100.87 (-4.47%) |
106.59 |
86.67 - 107.01 |
1.3239 times |
Mon 31 March 2025 |
105.59 (-5.42%) |
111.99 |
101.50 - 113.30 |
1.2353 times |
Fri 28 February 2025 |
111.64 (-17.8%) |
133.00 |
109.24 - 136.36 |
1.3631 times |
DMA SMA EMA moving averages of Toll Brothers TOL
DMA (daily moving average) of Toll Brothers TOL
| DMA period | DMA value | | 5 day DMA | 140.53 | | 12 day DMA | 135.2 | | 20 day DMA | 134.16 | | 35 day DMA | 134.88 | | 50 day DMA | 135.46 | | 100 day DMA | 133.49 | | 150 day DMA | 125.11 | | 200 day DMA | 119.81 | EMA (exponential moving average) of Toll Brothers TOL
| EMA period | EMA current | EMA prev | EMA prev2 | | 5 day EMA | 140.17 | 139.7 | 138.2 | | 12 day EMA | 137.36 | 136.68 | 135.58 | | 20 day EMA | 136.09 | 135.56 | 134.81 | | 35 day EMA | 135.76 | 135.45 | 135.02 | | 50 day EMA | 136.39 | 136.2 | 135.93 |
SMA (simple moving average) of Toll Brothers TOL
| SMA period | SMA current | SMA prev | SMA prev2 | | 5 day SMA | 140.53 | 140.41 | 139.53 | | 12 day SMA | 135.2 | 134 | 132.97 | | 20 day SMA | 134.16 | 133.79 | 133.34 | | 35 day SMA | 134.88 | 134.68 | 134.41 | | 50 day SMA | 135.46 | 135.44 | 135.38 | | 100 day SMA | 133.49 | 133.31 | 133.1 | | 150 day SMA | 125.11 | 124.84 | 124.56 | | 200 day SMA | 119.81 | 119.72 | 119.62 |
|
|
