TennantCompany TNC full analysis,charts,indicators,moving averages,SMA,DMA,EMA,ADX,MACD,RSITennant Company TNC WideScreen charts, DMA,SMA,EMA technical analysis, forecast prediction, by indicators ADX,MACD,RSI,CCI NYSE stock exchange
operates under Technology sector & deals in Industrial Machinery Components
Daily price and charts and targets TennantCompany Strong Daily Stock price targets for TennantCompany TNC are 74.04 and 75.27 | Daily Target 1 | 73.06 | | Daily Target 2 | 73.78 | | Daily Target 3 | 74.29 | | Daily Target 4 | 75.01 | | Daily Target 5 | 75.52 |
Daily price and volume Tennant Company
| Date |
Closing |
Open |
Range |
Volume |
Fri 05 December 2025 |
74.50 (0.31%) |
73.88 |
73.57 - 74.80 |
0.8469 times |
Thu 04 December 2025 |
74.27 (0.41%) |
73.87 |
73.24 - 74.61 |
0.6493 times |
Wed 03 December 2025 |
73.97 (2.17%) |
72.65 |
72.65 - 74.03 |
0.7877 times |
Tue 02 December 2025 |
72.40 (-0.15%) |
72.81 |
71.38 - 72.93 |
0.8025 times |
Mon 01 December 2025 |
72.51 (-0.85%) |
72.47 |
72.37 - 73.39 |
1.0741 times |
Fri 28 November 2025 |
73.13 (-0.87%) |
73.69 |
72.64 - 74.61 |
0.5153 times |
Wed 26 November 2025 |
73.77 (0.15%) |
72.96 |
72.79 - 75.11 |
1.8287 times |
Tue 25 November 2025 |
73.66 (4.08%) |
71.31 |
71.31 - 74.20 |
1.5084 times |
Mon 24 November 2025 |
70.77 (-1.32%) |
71.40 |
70.43 - 72.44 |
1.1533 times |
Fri 21 November 2025 |
71.72 (3.58%) |
69.60 |
69.60 - 72.48 |
0.8338 times |
Thu 20 November 2025 |
69.24 (0.39%) |
69.53 |
68.77 - 70.34 |
0.9896 times |
Weekly price and charts TennantCompany Strong weekly Stock price targets for TennantCompany TNC are 72.94 and 76.36 | Weekly Target 1 | 70.14 | | Weekly Target 2 | 72.32 | | Weekly Target 3 | 73.56 | | Weekly Target 4 | 75.74 | | Weekly Target 5 | 76.98 |
Weekly price and volumes for Tennant Company
| Date |
Closing |
Open |
Range |
Volume |
Fri 05 December 2025 |
74.50 (1.87%) |
72.47 |
71.38 - 74.80 |
1.216 times |
Fri 28 November 2025 |
73.13 (1.97%) |
71.40 |
70.43 - 75.11 |
1.463 times |
Fri 21 November 2025 |
71.72 (-0.65%) |
71.98 |
68.77 - 72.48 |
1.3121 times |
Fri 14 November 2025 |
72.19 (-3.2%) |
75.30 |
69.62 - 75.30 |
1.6731 times |
Fri 07 November 2025 |
74.58 (-6.78%) |
77.23 |
72.03 - 79.37 |
1.2603 times |
Fri 31 October 2025 |
80.00 (0%) |
79.80 |
79.25 - 81.30 |
0.234 times |
Fri 31 October 2025 |
80.00 (-2.06%) |
82.22 |
79.25 - 82.83 |
0.9026 times |
Fri 24 October 2025 |
81.68 (2.65%) |
80.33 |
80.25 - 83.00 |
0.6622 times |
Fri 17 October 2025 |
79.57 (-2.71%) |
79.04 |
77.66 - 81.19 |
0.969 times |
Tue 07 October 2025 |
81.79 (-1.23%) |
83.00 |
81.78 - 84.47 |
0.3077 times |
Fri 03 October 2025 |
82.81 (2.78%) |
80.64 |
79.40 - 84.06 |
1.1503 times |

Monthly price and charts TennantCompany Strong monthly Stock price targets for TennantCompany TNC are 72.94 and 76.36 | Monthly Target 1 | 70.14 | | Monthly Target 2 | 72.32 | | Monthly Target 3 | 73.56 | | Monthly Target 4 | 75.74 | | Monthly Target 5 | 76.98 |
Monthly price and volumes Tennant Company
| Date |
Closing |
Open |
Range |
Volume |
Fri 05 December 2025 |
74.50 (1.87%) |
72.47 |
71.38 - 74.80 |
0.2004 times |
Fri 28 November 2025 |
73.13 (-8.59%) |
77.23 |
68.77 - 79.37 |
0.9409 times |
Fri 31 October 2025 |
80.00 (-1.31%) |
80.40 |
77.66 - 84.47 |
0.6082 times |
Tue 30 September 2025 |
81.06 (-1.19%) |
81.15 |
79.36 - 83.91 |
1.0017 times |
Fri 29 August 2025 |
82.04 (-0.61%) |
81.67 |
78.63 - 85.43 |
0.9327 times |
Thu 31 July 2025 |
82.54 (6.53%) |
77.04 |
77.04 - 84.98 |
1.0163 times |
Mon 30 June 2025 |
77.48 (4.11%) |
74.27 |
71.89 - 78.67 |
1.2292 times |
Fri 30 May 2025 |
74.42 (3.13%) |
70.68 |
67.32 - 77.51 |
1.2347 times |
Wed 30 April 2025 |
72.16 (-9.52%) |
79.63 |
67.57 - 81.32 |
1.3001 times |
Mon 31 March 2025 |
79.75 (-7.87%) |
86.69 |
78.92 - 87.72 |
1.5357 times |
Fri 28 February 2025 |
86.56 (1.22%) |
83.36 |
82.23 - 90.44 |
1.8512 times |

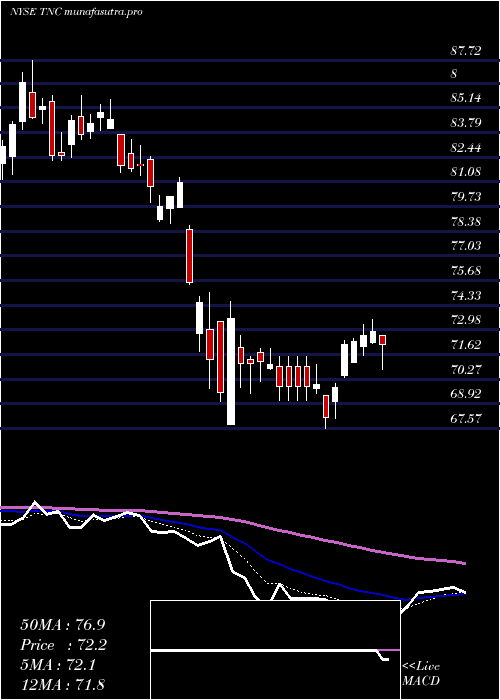
DMA SMA EMA moving averages of Tennant Company TNC
DMA (daily moving average) of Tennant Company TNC
| DMA period | DMA value | | 5 day DMA | 73.53 | | 12 day DMA | 72.41 | | 20 day DMA | 72.46 | | 35 day DMA | 75.51 | | 50 day DMA | 77.13 | | 100 day DMA | 79.49 | | 150 day DMA | 78.23 | | 200 day DMA | 78.51 | EMA (exponential moving average) of Tennant Company TNC
| EMA period | EMA current | EMA prev | EMA prev2 | | 5 day EMA | 73.78 | 73.42 | 73 | | 12 day EMA | 73.22 | 72.99 | 72.76 | | 20 day EMA | 73.63 | 73.54 | 73.46 | | 35 day EMA | 75.08 | 75.11 | 75.16 | | 50 day EMA | 77.12 | 77.23 | 77.35 |
SMA (simple moving average) of Tennant Company TNC
| SMA period | SMA current | SMA prev | SMA prev2 | | 5 day SMA | 73.53 | 73.26 | 73.16 | | 12 day SMA | 72.41 | 71.97 | 71.61 | | 20 day SMA | 72.46 | 72.46 | 72.49 | | 35 day SMA | 75.51 | 75.65 | 75.81 | | 50 day SMA | 77.13 | 77.26 | 77.38 | | 100 day SMA | 79.49 | 79.59 | 79.67 | | 150 day SMA | 78.23 | 78.22 | 78.2 | | 200 day SMA | 78.51 | 78.58 | 78.64 |
|
|
