ThermoFisher TMO full analysis,charts,indicators,moving averages,SMA,DMA,EMA,ADX,MACD,RSIThermo Fisher TMO WideScreen charts, DMA,SMA,EMA technical analysis, forecast prediction, by indicators ADX,MACD,RSI,CCI NYSE stock exchange
operates under Capital Goods sector & deals in Industrial Machinery Components
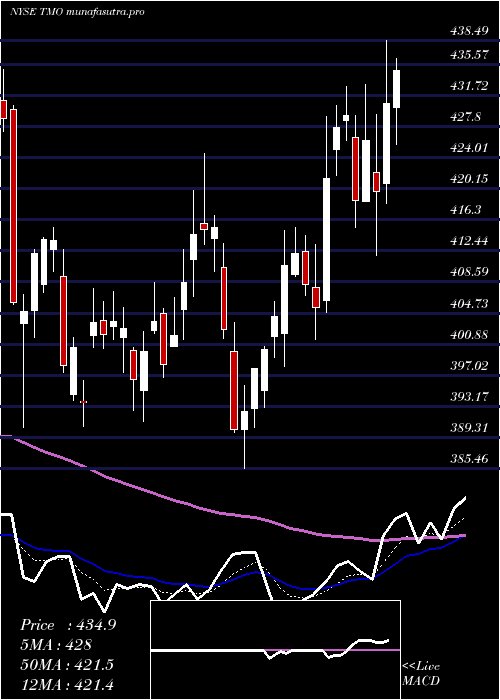
Daily price and charts and targets ThermoFisher Strong Daily Stock price targets for ThermoFisher TMO are 557.87 and 577.33 | Daily Target 1 | 552.14 | | Daily Target 2 | 563.59 | | Daily Target 3 | 571.60333333333 | | Daily Target 4 | 583.05 | | Daily Target 5 | 591.06 |
Daily price and volume Thermo Fisher
| Date |
Closing |
Open |
Range |
Volume |
Thu 04 December 2025 |
575.03 (-0.93%) |
579.03 |
560.16 - 579.62 |
0.7095 times |
Wed 03 December 2025 |
580.45 (0.01%) |
581.29 |
580.01 - 588.11 |
0.767 times |
Tue 02 December 2025 |
580.37 (-0.82%) |
581.94 |
577.96 - 584.45 |
1.2399 times |
Mon 01 December 2025 |
585.15 (-0.96%) |
594.85 |
582.75 - 597.68 |
1.134 times |
Fri 28 November 2025 |
590.83 (-0.41%) |
589.19 |
587.95 - 594.00 |
0.4821 times |
Wed 26 November 2025 |
593.25 (-0.76%) |
593.43 |
587.18 - 596.55 |
1.3316 times |
Tue 25 November 2025 |
597.78 (2%) |
582.20 |
581.80 - 602.32 |
1.1658 times |
Mon 24 November 2025 |
586.07 (-0.24%) |
586.45 |
579.10 - 587.92 |
1.1655 times |
Fri 21 November 2025 |
587.48 (2.57%) |
573.00 |
569.55 - 589.85 |
1.2498 times |
Thu 20 November 2025 |
572.74 (-0.18%) |
573.35 |
568.46 - 580.45 |
0.7549 times |
Wed 19 November 2025 |
573.79 (-0.39%) |
574.62 |
567.21 - 574.62 |
0.8066 times |
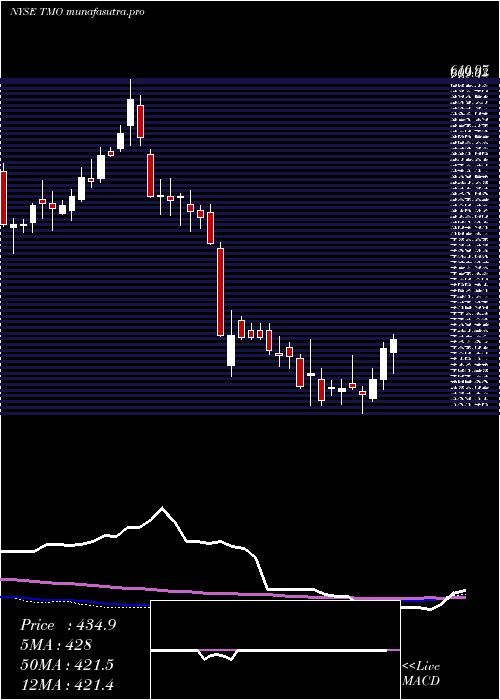
Weekly price and charts ThermoFisher Strong weekly Stock price targets for ThermoFisher TMO are 548.84 and 586.36 | Weekly Target 1 | 540.1 | | Weekly Target 2 | 557.57 | | Weekly Target 3 | 577.62333333333 | | Weekly Target 4 | 595.09 | | Weekly Target 5 | 615.14 |
Weekly price and volumes for Thermo Fisher
| Date |
Closing |
Open |
Range |
Volume |
Thu 04 December 2025 |
575.03 (-2.67%) |
594.85 |
560.16 - 597.68 |
0.7909 times |
Fri 28 November 2025 |
590.83 (0.57%) |
586.45 |
579.10 - 602.32 |
0.8514 times |
Fri 21 November 2025 |
587.48 (1.52%) |
575.65 |
556.46 - 589.85 |
1.0476 times |
Fri 14 November 2025 |
578.71 (1.1%) |
572.37 |
568.36 - 598.52 |
1.1045 times |
Fri 07 November 2025 |
572.41 (0.88%) |
558.41 |
554.20 - 577.35 |
0.911 times |
Fri 31 October 2025 |
567.39 (0%) |
551.92 |
551.87 - 569.92 |
0.2486 times |
Fri 31 October 2025 |
567.39 (-0.89%) |
572.09 |
551.60 - 572.67 |
1.0221 times |
Fri 24 October 2025 |
572.50 (6.23%) |
541.00 |
540.00 - 578.24 |
1.6854 times |
Fri 17 October 2025 |
538.92 (2.69%) |
527.53 |
519.45 - 544.60 |
1.1743 times |
Fri 10 October 2025 |
524.80 (-3.41%) |
541.70 |
523.65 - 549.44 |
1.1643 times |
Fri 03 October 2025 |
543.32 (17.03%) |
466.84 |
456.67 - 545.44 |
2.4346 times |
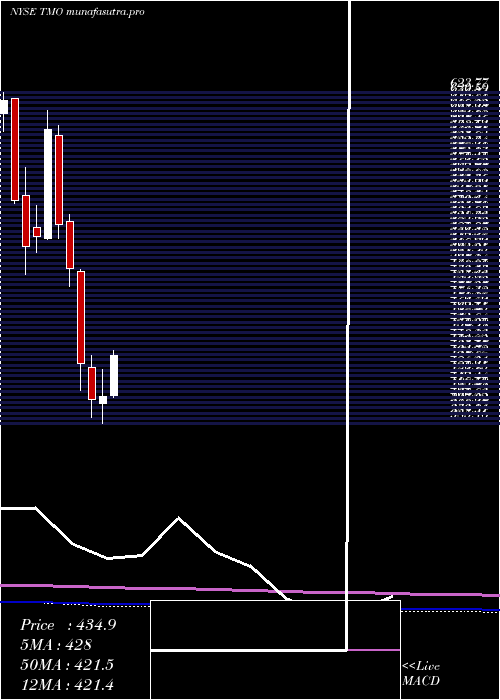
Monthly price and charts ThermoFisher Strong monthly Stock price targets for ThermoFisher TMO are 548.84 and 586.36 | Monthly Target 1 | 540.1 | | Monthly Target 2 | 557.57 | | Monthly Target 3 | 577.62333333333 | | Monthly Target 4 | 595.09 | | Monthly Target 5 | 615.14 |
Monthly price and volumes Thermo Fisher
| Date |
Closing |
Open |
Range |
Volume |
Thu 04 December 2025 |
575.03 (-2.67%) |
594.85 |
560.16 - 597.68 |
0.1332 times |
Fri 28 November 2025 |
590.83 (4.13%) |
558.41 |
554.20 - 602.32 |
0.6593 times |
Fri 31 October 2025 |
567.39 (16.98%) |
486.99 |
486.94 - 578.24 |
1.1367 times |
Tue 30 September 2025 |
485.02 (-1.56%) |
489.31 |
456.67 - 502.00 |
1.0137 times |
Fri 29 August 2025 |
492.72 (5.35%) |
461.03 |
446.28 - 502.39 |
0.8627 times |
Thu 31 July 2025 |
467.68 (15.35%) |
406.29 |
403.36 - 488.52 |
1.5886 times |
Mon 30 June 2025 |
405.46 (0.66%) |
400.14 |
385.46 - 424.51 |
1.1994 times |
Fri 30 May 2025 |
402.82 (-6.1%) |
425.86 |
390.50 - 434.98 |
1.301 times |
Wed 30 April 2025 |
429.00 (-13.79%) |
495.56 |
409.85 - 496.51 |
1.3373 times |
Mon 31 March 2025 |
497.60 (-5.93%) |
530.92 |
484.27 - 536.21 |
0.768 times |
Fri 28 February 2025 |
528.96 (-11.51%) |
593.13 |
519.13 - 600.41 |
0.828 times |
DMA SMA EMA moving averages of Thermo Fisher TMO
DMA (daily moving average) of Thermo Fisher TMO
| DMA period | DMA value | | 5 day DMA | 582.37 | | 12 day DMA | 583.25 | | 20 day DMA | 580.71 | | 35 day DMA | 571.63 | | 50 day DMA | 554.67 | | 100 day DMA | 514.27 | | 150 day DMA | 479.79 | | 200 day DMA | 480.86 | EMA (exponential moving average) of Thermo Fisher TMO
| EMA period | EMA current | EMA prev | EMA prev2 | | 5 day EMA | 580.89 | 583.82 | 585.5 | | 12 day EMA | 581.6 | 582.8 | 583.23 | | 20 day EMA | 577.69 | 577.97 | 577.71 | | 35 day EMA | 564.68 | 564.07 | 563.11 | | 50 day EMA | 550.82 | 549.83 | 548.58 |
SMA (simple moving average) of Thermo Fisher TMO
| SMA period | SMA current | SMA prev | SMA prev2 | | 5 day SMA | 582.37 | 586.01 | 589.48 | | 12 day SMA | 583.25 | 582.59 | 582.45 | | 20 day SMA | 580.71 | 580.34 | 579.58 | | 35 day SMA | 571.63 | 570.28 | 568.72 | | 50 day SMA | 554.67 | 552.53 | 550.32 | | 100 day SMA | 514.27 | 512.7 | 511.14 | | 150 day SMA | 479.79 | 478.82 | 477.8 | | 200 day SMA | 480.86 | 480.6 | 480.36 |
|
|
