TillyS TLYS full analysis,charts,indicators,moving averages,SMA,DMA,EMA,ADX,MACD,RSITilly S TLYS WideScreen charts, DMA,SMA,EMA technical analysis, forecast prediction, by indicators ADX,MACD,RSI,CCI NYSE stock exchange
operates under Consumer Services sector & deals in Clothing Shoe Accessory Stores
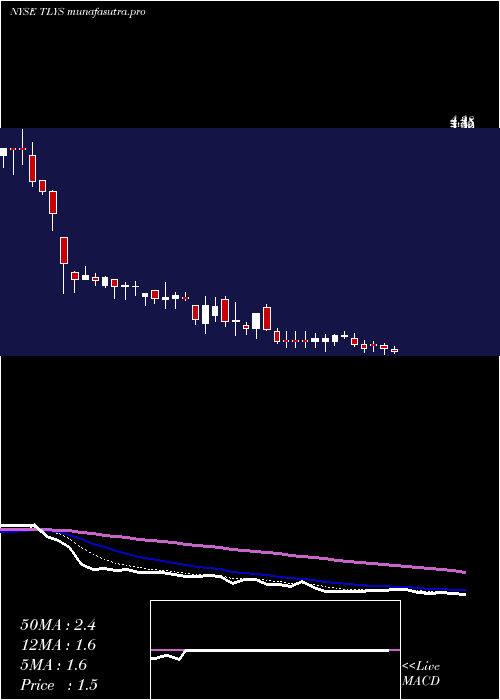
Daily price and charts and targets TillyS Strong Daily Stock price targets for TillyS TLYS are 1.55 and 1.64 | Daily Target 1 | 1.47 | | Daily Target 2 | 1.53 | | Daily Target 3 | 1.56 | | Daily Target 4 | 1.62 | | Daily Target 5 | 1.65 |
Daily price and volume Tilly S
| Date |
Closing |
Open |
Range |
Volume |
Mon 20 October 2025 |
1.59 (6%) |
1.50 |
1.50 - 1.59 |
0.5143 times |
Fri 17 October 2025 |
1.50 (-1.96%) |
1.51 |
1.48 - 1.62 |
1.4725 times |
Thu 16 October 2025 |
1.53 (-4.38%) |
1.57 |
1.52 - 1.64 |
1.0903 times |
Wed 15 October 2025 |
1.60 (-3.03%) |
1.68 |
1.55 - 1.77 |
0.6236 times |
Tue 14 October 2025 |
1.65 (1.85%) |
1.56 |
1.56 - 1.69 |
0.2815 times |
Mon 13 October 2025 |
1.62 (3.85%) |
1.56 |
1.54 - 1.63 |
0.4006 times |
Fri 10 October 2025 |
1.56 (-9.83%) |
1.78 |
1.52 - 1.82 |
1.7421 times |
Thu 09 October 2025 |
1.73 (-3.35%) |
1.84 |
1.70 - 1.84 |
0.6366 times |
Wed 08 October 2025 |
1.79 (-3.76%) |
1.91 |
1.71 - 1.91 |
2.1535 times |
Tue 07 October 2025 |
1.86 (-4.62%) |
1.99 |
1.85 - 1.99 |
1.0849 times |
Mon 06 October 2025 |
1.95 (-2.01%) |
2.00 |
1.93 - 2.00 |
0.4637 times |
Weekly price and charts TillyS Strong weekly Stock price targets for TillyS TLYS are 1.55 and 1.64 | Weekly Target 1 | 1.47 | | Weekly Target 2 | 1.53 | | Weekly Target 3 | 1.56 | | Weekly Target 4 | 1.62 | | Weekly Target 5 | 1.65 |
Weekly price and volumes for Tilly S
| Date |
Closing |
Open |
Range |
Volume |
Mon 20 October 2025 |
1.59 (6%) |
1.50 |
1.50 - 1.59 |
0.0652 times |
Fri 17 October 2025 |
1.50 (-3.85%) |
1.56 |
1.48 - 1.77 |
0.4902 times |
Fri 10 October 2025 |
1.56 (-21.61%) |
2.00 |
1.52 - 2.00 |
0.7705 times |
Fri 03 October 2025 |
1.99 (-4.33%) |
2.05 |
1.94 - 2.09 |
0.3448 times |
Fri 26 September 2025 |
2.08 (13.66%) |
1.98 |
1.83 - 2.21 |
0.6575 times |
Fri 19 September 2025 |
1.83 (-2.66%) |
1.96 |
1.83 - 2.05 |
0.9942 times |
Fri 12 September 2025 |
1.88 (-1.05%) |
1.97 |
1.83 - 2.08 |
1.1725 times |
Fri 05 September 2025 |
1.90 (-3.55%) |
1.96 |
1.78 - 2.44 |
4.2187 times |
Fri 29 August 2025 |
1.97 (0%) |
2.02 |
1.90 - 2.03 |
0.1605 times |
Fri 29 August 2025 |
1.97 (10.06%) |
1.73 |
1.68 - 2.06 |
1.1259 times |
Fri 22 August 2025 |
1.79 (16.99%) |
1.57 |
1.44 - 1.83 |
0.8182 times |
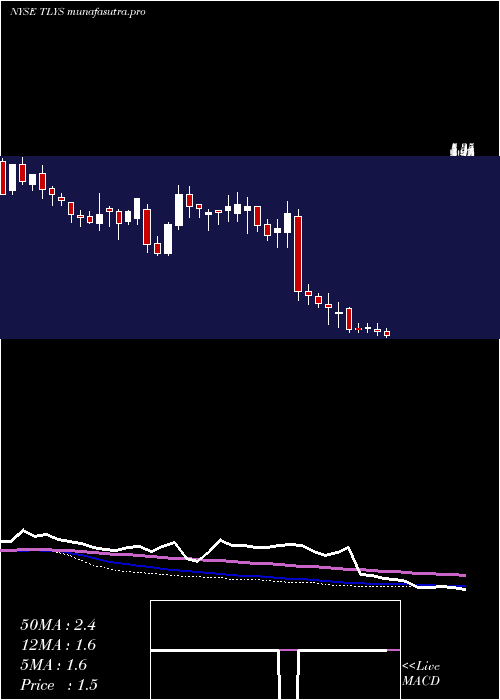
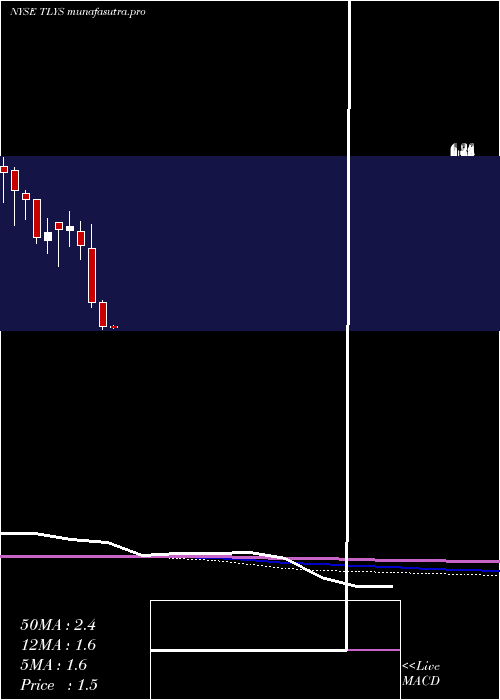
Monthly price and charts TillyS Strong monthly Stock price targets for TillyS TLYS are 1.23 and 1.84 | Monthly Target 1 | 1.11 | | Monthly Target 2 | 1.35 | | Monthly Target 3 | 1.72 | | Monthly Target 4 | 1.96 | | Monthly Target 5 | 2.33 |
Monthly price and volumes Tilly S
| Date |
Closing |
Open |
Range |
Volume |
Mon 20 October 2025 |
1.59 (-22.82%) |
2.03 |
1.48 - 2.09 |
0.182 times |
Tue 30 September 2025 |
2.06 (4.57%) |
1.96 |
1.78 - 2.44 |
0.8938 times |
Fri 29 August 2025 |
1.97 (10.06%) |
1.75 |
1.22 - 2.06 |
0.5247 times |
Thu 31 July 2025 |
1.79 (29.71%) |
1.54 |
1.32 - 2.31 |
1.3785 times |
Mon 30 June 2025 |
1.38 (-3.5%) |
1.47 |
1.12 - 2.23 |
3.394 times |
Fri 30 May 2025 |
1.43 (-6.54%) |
1.52 |
0.57 - 1.56 |
2.2602 times |
Wed 30 April 2025 |
1.53 (-30.45%) |
2.19 |
1.45 - 2.27 |
0.3333 times |
Mon 31 March 2025 |
2.20 (-42.11%) |
3.73 |
2.06 - 4.40 |
0.46 times |
Fri 28 February 2025 |
3.80 (-12.24%) |
4.20 |
3.40 - 4.48 |
0.2456 times |
Fri 31 January 2025 |
4.33 (1.88%) |
4.23 |
3.77 - 4.75 |
0.3279 times |
Tue 31 December 2024 |
4.25 (1.67%) |
4.46 |
3.22 - 4.46 |
0.4232 times |
DMA SMA EMA moving averages of Tilly S TLYS
DMA (daily moving average) of Tilly S TLYS
| DMA period | DMA value | | 5 day DMA | 1.57 | | 12 day DMA | 1.7 | | 20 day DMA | 1.83 | | 35 day DMA | 1.88 | | 50 day DMA | 1.83 | | 100 day DMA | 1.63 | | 150 day DMA | 1.63 | | 200 day DMA | 2.23 | EMA (exponential moving average) of Tilly S TLYS
| EMA period | EMA current | EMA prev | EMA prev2 | | 5 day EMA | 1.58 | 1.58 | 1.62 | | 12 day EMA | 1.67 | 1.69 | 1.72 | | 20 day EMA | 1.74 | 1.76 | 1.79 | | 35 day EMA | 1.76 | 1.77 | 1.79 | | 50 day EMA | 1.77 | 1.78 | 1.79 |
SMA (simple moving average) of Tilly S TLYS
| SMA period | SMA current | SMA prev | SMA prev2 | | 5 day SMA | 1.57 | 1.58 | 1.59 | | 12 day SMA | 1.7 | 1.73 | 1.78 | | 20 day SMA | 1.83 | 1.84 | 1.86 | | 35 day SMA | 1.88 | 1.9 | 1.91 | | 50 day SMA | 1.83 | 1.82 | 1.82 | | 100 day SMA | 1.63 | 1.62 | 1.62 | | 150 day SMA | 1.63 | 1.64 | 1.65 | | 200 day SMA | 2.23 | 2.24 | 2.25 |
|
|
