TargetCorporation TGT full analysis,charts,indicators,moving averages,SMA,DMA,EMA,ADX,MACD,RSITarget Corporation TGT WideScreen charts, DMA,SMA,EMA technical analysis, forecast prediction, by indicators ADX,MACD,RSI,CCI NYSE stock exchange
operates under Consumer Services sector & deals in Department Specialty Retail Stores
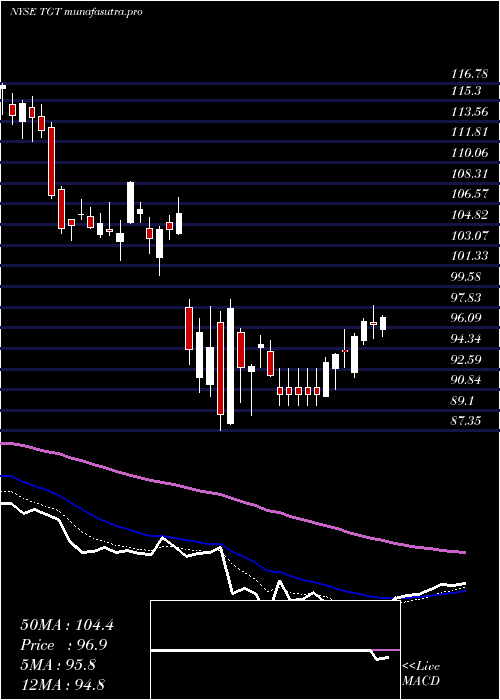
Daily price and charts and targets TargetCorporation Strong Daily Stock price targets for TargetCorporation TGT are 90.88 and 92.91 | Daily Target 1 | 89.29 | | Daily Target 2 | 90.44 | | Daily Target 3 | 91.32 | | Daily Target 4 | 92.47 | | Daily Target 5 | 93.35 |
Daily price and volume Target Corporation
| Date |
Closing |
Open |
Range |
Volume |
Thu 04 December 2025 |
91.59 (0.74%) |
91.11 |
90.17 - 92.20 |
0.6117 times |
Wed 03 December 2025 |
90.92 (0.55%) |
90.67 |
90.60 - 92.91 |
1.1578 times |
Tue 02 December 2025 |
90.42 (-1.03%) |
91.34 |
89.36 - 92.00 |
0.5667 times |
Mon 01 December 2025 |
91.36 (0.82%) |
90.40 |
90.14 - 93.11 |
1.0409 times |
Fri 28 November 2025 |
90.62 (0.9%) |
90.28 |
89.87 - 91.70 |
0.643 times |
Wed 26 November 2025 |
89.81 (3.78%) |
85.93 |
85.93 - 90.23 |
0.7363 times |
Tue 25 November 2025 |
86.54 (2.38%) |
84.63 |
84.63 - 86.63 |
0.5757 times |
Mon 24 November 2025 |
84.53 (-3.53%) |
88.06 |
84.52 - 88.20 |
0.7669 times |
Fri 21 November 2025 |
87.62 (4.71%) |
84.44 |
84.24 - 88.98 |
1.9916 times |
Thu 20 November 2025 |
83.68 (-2.79%) |
86.16 |
83.44 - 86.93 |
1.9093 times |
Wed 19 November 2025 |
86.08 (-2.76%) |
86.42 |
85.30 - 89.62 |
3.0056 times |
Weekly price and charts TargetCorporation Strong weekly Stock price targets for TargetCorporation TGT are 90.48 and 94.23 | Weekly Target 1 | 87.6 | | Weekly Target 2 | 89.6 | | Weekly Target 3 | 91.353333333333 | | Weekly Target 4 | 93.35 | | Weekly Target 5 | 95.1 |
Weekly price and volumes for Target Corporation
| Date |
Closing |
Open |
Range |
Volume |
Thu 04 December 2025 |
91.59 (1.07%) |
90.40 |
89.36 - 93.11 |
0.8594 times |
Fri 28 November 2025 |
90.62 (3.42%) |
88.06 |
84.52 - 91.70 |
0.6926 times |
Fri 21 November 2025 |
87.62 (-2.54%) |
89.52 |
83.44 - 90.26 |
2.3078 times |
Fri 14 November 2025 |
89.90 (-1.47%) |
91.82 |
89.41 - 93.43 |
0.9638 times |
Fri 07 November 2025 |
91.24 (-1.6%) |
91.19 |
88.48 - 93.26 |
0.6991 times |
Fri 31 October 2025 |
92.72 (0%) |
92.55 |
91.51 - 93.04 |
0.2856 times |
Fri 31 October 2025 |
92.72 (-1.63%) |
95.25 |
91.51 - 99.49 |
1.4835 times |
Fri 24 October 2025 |
94.26 (3.76%) |
91.23 |
90.75 - 95.61 |
0.7625 times |
Fri 17 October 2025 |
90.84 (1.76%) |
86.92 |
86.35 - 91.65 |
1.4224 times |
Tue 07 October 2025 |
89.27 (0.3%) |
89.35 |
87.84 - 90.17 |
0.5233 times |
Fri 03 October 2025 |
89.00 (1.31%) |
88.36 |
87.25 - 90.37 |
1.8361 times |
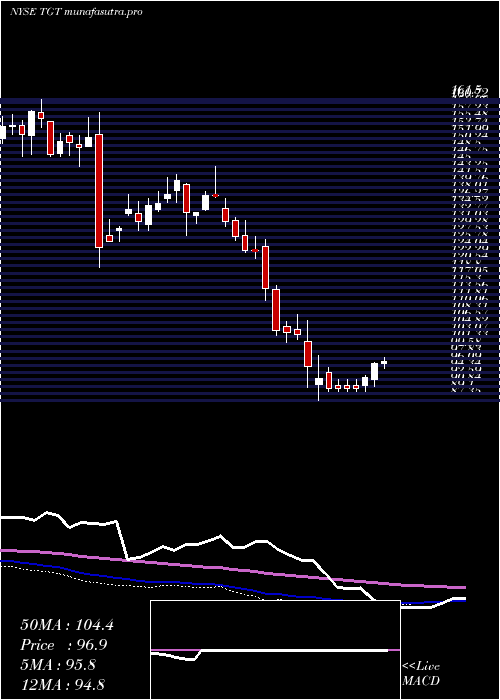
Monthly price and charts TargetCorporation Strong monthly Stock price targets for TargetCorporation TGT are 90.48 and 94.23 | Monthly Target 1 | 87.6 | | Monthly Target 2 | 89.6 | | Monthly Target 3 | 91.353333333333 | | Monthly Target 4 | 93.35 | | Monthly Target 5 | 95.1 |
Monthly price and volumes Target Corporation
| Date |
Closing |
Open |
Range |
Volume |
Thu 04 December 2025 |
91.59 (1.07%) |
90.40 |
89.36 - 93.11 |
0.154 times |
Fri 28 November 2025 |
90.62 (-2.26%) |
91.19 |
83.44 - 93.43 |
0.8356 times |
Fri 31 October 2025 |
92.72 (3.37%) |
89.48 |
86.35 - 99.49 |
0.952 times |
Tue 30 September 2025 |
89.70 (-6.54%) |
95.13 |
86.30 - 95.36 |
1.3735 times |
Fri 29 August 2025 |
95.98 (-4.5%) |
99.52 |
94.15 - 107.82 |
1.1898 times |
Thu 31 July 2025 |
100.50 (1.88%) |
98.33 |
98.32 - 108.90 |
0.82 times |
Mon 30 June 2025 |
98.65 (4.94%) |
93.41 |
92.06 - 102.37 |
0.881 times |
Fri 30 May 2025 |
94.01 (-2.78%) |
97.11 |
90.60 - 103.00 |
1.2364 times |
Wed 30 April 2025 |
96.70 (-7.34%) |
104.98 |
87.35 - 107.09 |
1.2668 times |
Mon 31 March 2025 |
104.36 (-16%) |
125.27 |
100.50 - 127.06 |
1.291 times |
Fri 28 February 2025 |
124.24 (-9.91%) |
134.58 |
122.36 - 137.05 |
0.8144 times |

DMA SMA EMA moving averages of Target Corporation TGT
DMA (daily moving average) of Target Corporation TGT
| DMA period | DMA value | | 5 day DMA | 90.98 | | 12 day DMA | 88.47 | | 20 day DMA | 89.27 | | 35 day DMA | 90.97 | | 50 day DMA | 90.25 | | 100 day DMA | 94.71 | | 150 day DMA | 95.62 | | 200 day DMA | 98.3 | EMA (exponential moving average) of Target Corporation TGT
| EMA period | EMA current | EMA prev | EMA prev2 | | 5 day EMA | 90.64 | 90.17 | 89.79 | | 12 day EMA | 89.78 | 89.45 | 89.18 | | 20 day EMA | 89.76 | 89.57 | 89.43 | | 35 day EMA | 89.71 | 89.6 | 89.52 | | 50 day EMA | 90.22 | 90.16 | 90.13 |
SMA (simple moving average) of Target Corporation TGT
| SMA period | SMA current | SMA prev | SMA prev2 | | 5 day SMA | 90.98 | 90.63 | 89.75 | | 12 day SMA | 88.47 | 88.22 | 88.13 | | 20 day SMA | 89.27 | 89.28 | 89.24 | | 35 day SMA | 90.97 | 90.95 | 90.9 | | 50 day SMA | 90.25 | 90.18 | 90.15 | | 100 day SMA | 94.71 | 94.84 | 94.96 | | 150 day SMA | 95.62 | 95.65 | 95.68 | | 200 day SMA | 98.3 | 98.48 | 98.66 |
|
|
