TransportadoraDe TGS full analysis,charts,indicators,moving averages,SMA,DMA,EMA,ADX,MACD,RSITransportadora De TGS WideScreen charts, DMA,SMA,EMA technical analysis, forecast prediction, by indicators ADX,MACD,RSI,CCI NYSE stock exchange
operates under Public Utilities sector & deals in Natural Gas Distribution
Daily price and charts and targets TransportadoraDe Strong Daily Stock price targets for TransportadoraDe TGS are 20.53 and 22.25 | Daily Target 1 | 20.15 | | Daily Target 2 | 20.9 | | Daily Target 3 | 21.866666666667 | | Daily Target 4 | 22.62 | | Daily Target 5 | 23.59 |
Daily price and volume Transportadora De
| Date |
Closing |
Open |
Range |
Volume |
Mon 20 October 2025 |
21.66 (-2.65%) |
22.39 |
21.11 - 22.83 |
0.8658 times |
Fri 17 October 2025 |
22.25 (-0.31%) |
22.15 |
22.02 - 22.44 |
0.3304 times |
Thu 16 October 2025 |
22.32 (-1.63%) |
22.75 |
21.85 - 22.86 |
0.5685 times |
Wed 15 October 2025 |
22.69 (1.43%) |
22.72 |
22.04 - 23.61 |
1.2541 times |
Tue 14 October 2025 |
22.37 (-6.71%) |
23.42 |
22.37 - 24.64 |
1.9085 times |
Mon 13 October 2025 |
23.98 (7.29%) |
22.84 |
22.66 - 24.23 |
1.4232 times |
Fri 10 October 2025 |
22.35 (-3.41%) |
23.36 |
22.00 - 23.47 |
0.936 times |
Thu 09 October 2025 |
23.14 (9.93%) |
21.40 |
21.17 - 23.35 |
1.5569 times |
Wed 08 October 2025 |
21.05 (1.59%) |
20.67 |
20.36 - 21.23 |
0.4675 times |
Tue 07 October 2025 |
20.72 (-2.59%) |
21.31 |
20.72 - 21.54 |
0.6892 times |
Mon 06 October 2025 |
21.27 (0.47%) |
21.34 |
20.94 - 21.54 |
1.0081 times |
Weekly price and charts TransportadoraDe Strong weekly Stock price targets for TransportadoraDe TGS are 20.53 and 22.25 | Weekly Target 1 | 20.15 | | Weekly Target 2 | 20.9 | | Weekly Target 3 | 21.866666666667 | | Weekly Target 4 | 22.62 | | Weekly Target 5 | 23.59 |
Weekly price and volumes for Transportadora De
| Date |
Closing |
Open |
Range |
Volume |
Mon 20 October 2025 |
21.66 (-2.65%) |
22.39 |
21.11 - 22.83 |
0.1602 times |
Fri 17 October 2025 |
22.25 (-0.45%) |
22.84 |
21.85 - 24.64 |
1.0146 times |
Fri 10 October 2025 |
22.35 (5.57%) |
21.34 |
20.36 - 23.47 |
0.8616 times |
Fri 03 October 2025 |
21.17 (-3.33%) |
21.90 |
20.01 - 21.97 |
1.0264 times |
Fri 26 September 2025 |
21.90 (6.31%) |
22.90 |
21.90 - 24.50 |
1.299 times |
Fri 19 September 2025 |
20.60 (-2.32%) |
21.56 |
19.74 - 22.51 |
1.6616 times |
Fri 12 September 2025 |
21.09 (-20.23%) |
22.07 |
20.45 - 24.01 |
1.8526 times |
Fri 05 September 2025 |
26.44 (-2.65%) |
26.76 |
25.28 - 27.13 |
0.8061 times |
Fri 29 August 2025 |
27.16 (0%) |
27.15 |
27.03 - 27.58 |
0.1581 times |
Fri 29 August 2025 |
27.16 (-2.55%) |
27.72 |
25.83 - 28.34 |
1.1599 times |
Fri 22 August 2025 |
27.87 (-0.57%) |
27.89 |
26.74 - 29.00 |
0.79 times |
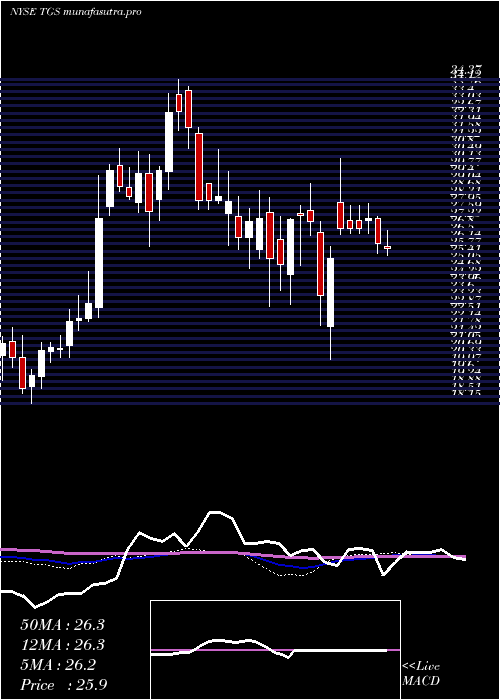
Monthly price and charts TransportadoraDe Strong monthly Stock price targets for TransportadoraDe TGS are 20.84 and 25.47 | Monthly Target 1 | 17.47 | | Monthly Target 2 | 19.57 | | Monthly Target 3 | 22.103333333333 | | Monthly Target 4 | 24.2 | | Monthly Target 5 | 26.73 |
Monthly price and volumes Transportadora De
| Date |
Closing |
Open |
Range |
Volume |
Mon 20 October 2025 |
21.66 (3%) |
20.97 |
20.01 - 24.64 |
0.8335 times |
Tue 30 September 2025 |
21.03 (-22.57%) |
26.76 |
19.74 - 27.13 |
1.9813 times |
Fri 29 August 2025 |
27.16 (-5.37%) |
28.59 |
25.83 - 30.50 |
1.0565 times |
Thu 31 July 2025 |
28.70 (10.81%) |
25.40 |
24.07 - 30.16 |
0.9992 times |
Mon 30 June 2025 |
25.90 (-7.57%) |
28.35 |
25.51 - 29.50 |
0.8944 times |
Fri 30 May 2025 |
28.02 (10.18%) |
25.50 |
24.59 - 32.81 |
0.8174 times |
Wed 30 April 2025 |
25.43 (-3.89%) |
26.13 |
20.33 - 30.41 |
0.8065 times |
Mon 31 March 2025 |
26.46 (4.13%) |
26.34 |
23.12 - 29.13 |
0.6758 times |
Fri 28 February 2025 |
25.41 (-10.02%) |
27.49 |
23.01 - 28.82 |
0.8343 times |
Fri 31 January 2025 |
28.24 (-3.52%) |
29.61 |
26.07 - 34.37 |
1.101 times |
Tue 31 December 2024 |
29.27 (0.9%) |
28.37 |
26.02 - 30.77 |
0.5288 times |

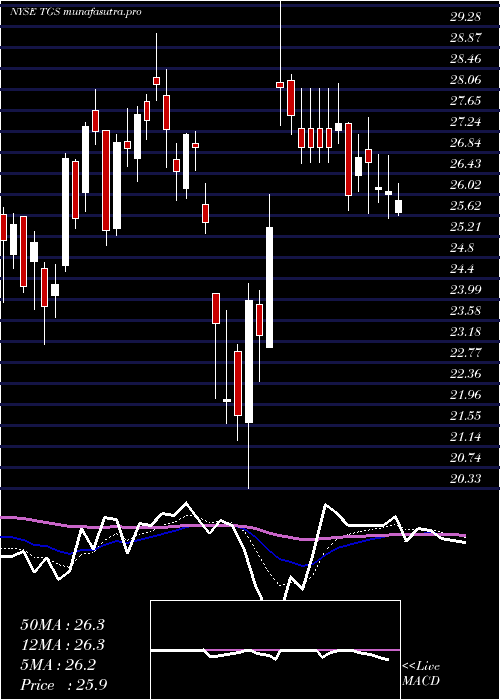
DMA SMA EMA moving averages of Transportadora De TGS
DMA (daily moving average) of Transportadora De TGS
| DMA period | DMA value | | 5 day DMA | 22.26 | | 12 day DMA | 22.08 | | 20 day DMA | 21.94 | | 35 day DMA | 22.37 | | 50 day DMA | 23.95 | | 100 day DMA | 25.72 | | 150 day DMA | 26.2 | | 200 day DMA | 26.62 | EMA (exponential moving average) of Transportadora De TGS
| EMA period | EMA current | EMA prev | EMA prev2 | | 5 day EMA | 22.17 | 22.42 | 22.5 | | 12 day EMA | 22.15 | 22.24 | 22.24 | | 20 day EMA | 22.28 | 22.35 | 22.36 | | 35 day EMA | 23.24 | 23.33 | 23.39 | | 50 day EMA | 24.22 | 24.32 | 24.4 |
SMA (simple moving average) of Transportadora De TGS
| SMA period | SMA current | SMA prev | SMA prev2 | | 5 day SMA | 22.26 | 22.72 | 22.74 | | 12 day SMA | 22.08 | 22.01 | 21.85 | | 20 day SMA | 21.94 | 21.99 | 21.91 | | 35 day SMA | 22.37 | 22.53 | 22.67 | | 50 day SMA | 23.95 | 24.1 | 24.22 | | 100 day SMA | 25.72 | 25.82 | 25.9 | | 150 day SMA | 26.2 | 26.24 | 26.26 | | 200 day SMA | 26.62 | 26.68 | 26.71 |
|
|
