TallgrassEnergy TGE full analysis,charts,indicators,moving averages,SMA,DMA,EMA,ADX,MACD,RSITallgrass Energy TGE WideScreen charts, DMA,SMA,EMA technical analysis, forecast prediction, by indicators ADX,MACD,RSI,CCI NYSE stock exchange
operates under Public Utilities sector & deals in Natural Gas Distribution
Daily price and charts and targets TallgrassEnergy Strong Daily Stock price targets for TallgrassEnergy TGE are 1.67 and 2.18 | Daily Target 1 | 1.26 | | Daily Target 2 | 1.56 | | Daily Target 3 | 1.77 | | Daily Target 4 | 2.07 | | Daily Target 5 | 2.28 |
Daily price and volume Tallgrass Energy
| Date |
Closing |
Open |
Range |
Volume |
Mon 20 October 2025 |
1.86 (28.28%) |
1.55 |
1.47 - 1.98 |
4.8428 times |
Fri 17 October 2025 |
1.45 (-6.45%) |
1.46 |
1.41 - 1.52 |
0.4533 times |
Thu 16 October 2025 |
1.55 (-4.32%) |
1.72 |
1.47 - 1.73 |
0.7835 times |
Wed 15 October 2025 |
1.62 (-6.36%) |
1.72 |
1.62 - 1.80 |
0.6963 times |
Tue 14 October 2025 |
1.73 (2.98%) |
1.73 |
1.65 - 1.75 |
0.3328 times |
Mon 13 October 2025 |
1.68 (-10.16%) |
1.96 |
1.67 - 1.96 |
0.5719 times |
Fri 10 October 2025 |
1.87 (-8.78%) |
2.03 |
1.77 - 2.07 |
0.9488 times |
Thu 09 October 2025 |
2.05 (-3.3%) |
2.23 |
2.02 - 2.23 |
0.3175 times |
Wed 08 October 2025 |
2.12 (0.95%) |
2.07 |
2.05 - 2.19 |
0.44 times |
Tue 07 October 2025 |
2.10 (-2.33%) |
2.11 |
2.04 - 2.25 |
0.6131 times |
Mon 06 October 2025 |
2.15 (2.38%) |
2.00 |
1.99 - 2.18 |
0.5119 times |
Weekly price and charts TallgrassEnergy Strong weekly Stock price targets for TallgrassEnergy TGE are 1.67 and 2.18 | Weekly Target 1 | 1.26 | | Weekly Target 2 | 1.56 | | Weekly Target 3 | 1.77 | | Weekly Target 4 | 2.07 | | Weekly Target 5 | 2.28 |
Weekly price and volumes for Tallgrass Energy
| Date |
Closing |
Open |
Range |
Volume |
Mon 20 October 2025 |
1.86 (28.28%) |
1.55 |
1.47 - 1.98 |
0.2243 times |
Fri 17 October 2025 |
1.45 (-22.46%) |
1.96 |
1.41 - 1.96 |
0.1314 times |
Fri 10 October 2025 |
1.87 (-10.95%) |
2.00 |
1.77 - 2.25 |
0.1311 times |
Fri 03 October 2025 |
2.10 (-2.33%) |
2.11 |
1.93 - 2.34 |
0.1984 times |
Fri 26 September 2025 |
2.15 (-13.31%) |
2.41 |
2.04 - 2.89 |
0.3829 times |
Fri 19 September 2025 |
2.48 (-10.47%) |
2.80 |
2.42 - 4.40 |
8.663 times |
Fri 12 September 2025 |
2.77 (-6.1%) |
3.06 |
2.58 - 3.69 |
0.1639 times |
Fri 05 September 2025 |
2.95 (-6.05%) |
3.20 |
2.67 - 3.38 |
0.0467 times |
Fri 29 August 2025 |
3.14 (0%) |
3.31 |
3.04 - 3.31 |
0.0068 times |
Fri 29 August 2025 |
3.14 (-14.91%) |
3.73 |
3.04 - 3.74 |
0.0515 times |
Fri 22 August 2025 |
3.69 (13.54%) |
3.15 |
3.05 - 3.89 |
0.1329 times |
Monthly price and charts TallgrassEnergy Strong monthly Stock price targets for TallgrassEnergy TGE are 1.22 and 2.06 | Monthly Target 1 | 1 | | Monthly Target 2 | 1.43 | | Monthly Target 3 | 1.84 | | Monthly Target 4 | 2.27 | | Monthly Target 5 | 2.68 |
Monthly price and volumes Tallgrass Energy
| Date |
Closing |
Open |
Range |
Volume |
Mon 20 October 2025 |
1.86 (-13.08%) |
2.10 |
1.41 - 2.25 |
0.0219 times |
Tue 30 September 2025 |
2.14 (-31.85%) |
3.20 |
1.95 - 4.40 |
0.3593 times |
Fri 29 August 2025 |
3.14 (-43.01%) |
5.35 |
2.99 - 5.55 |
0.0169 times |
Thu 31 July 2025 |
5.51 (-30.34%) |
7.93 |
5.23 - 8.03 |
0.0331 times |
Mon 30 June 2025 |
7.91 (-64.67%) |
16.91 |
5.60 - 37.02 |
0.146 times |
Fri 17 April 2020 |
22.39 (36.03%) |
16.37 |
15.64 - 22.39 |
1.4424 times |
Tue 31 March 2020 |
16.46 (-25.42%) |
22.11 |
10.93 - 22.11 |
2.8927 times |
Fri 28 February 2020 |
22.07 (-1.08%) |
22.29 |
21.94 - 22.36 |
0.7692 times |
Fri 31 January 2020 |
22.31 (0.86%) |
22.11 |
22.10 - 22.38 |
1.4419 times |
Tue 31 December 2019 |
22.12 (23.51%) |
17.99 |
17.58 - 22.18 |
2.8766 times |
Fri 29 November 2019 |
17.91 (-4.02%) |
18.72 |
17.47 - 18.82 |
0.5488 times |
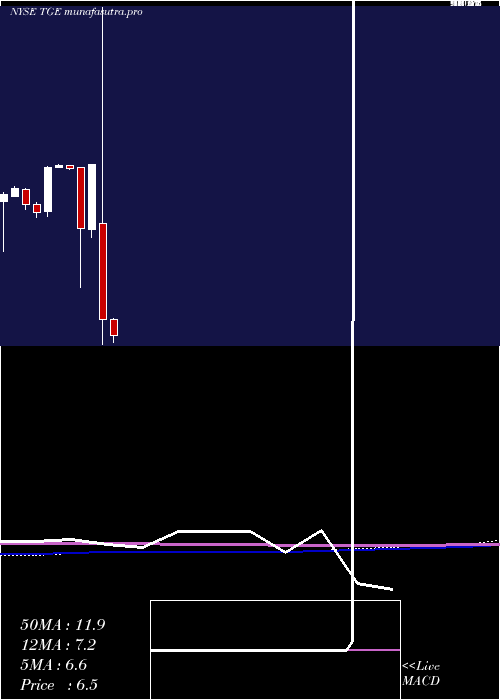
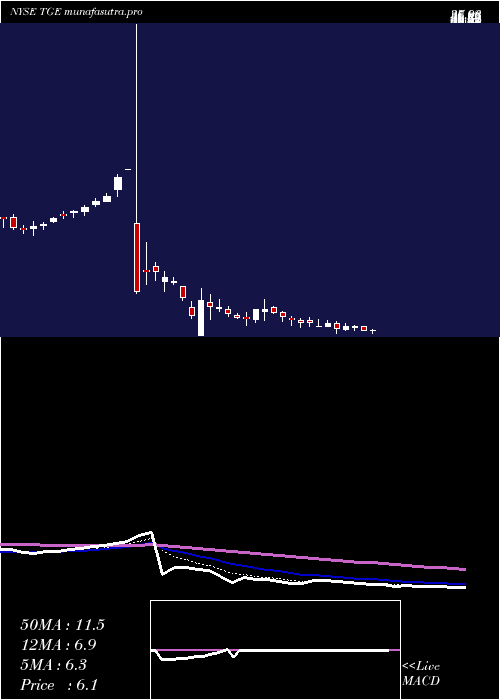
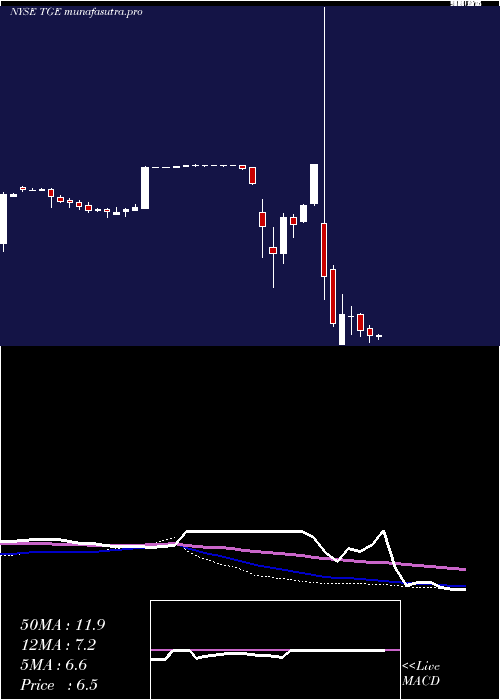
DMA SMA EMA moving averages of Tallgrass Energy TGE
DMA (daily moving average) of Tallgrass Energy TGE
| DMA period | DMA value | | 5 day DMA | 1.64 | | 12 day DMA | 1.86 | | 20 day DMA | 2 | | 35 day DMA | 2.33 | | 50 day DMA | 2.64 | | 100 day DMA | 5.62 | | 150 day DMA | 10.24 | | 200 day DMA | 12.78 | EMA (exponential moving average) of Tallgrass Energy TGE
| EMA period | EMA current | EMA prev | EMA prev2 | | 5 day EMA | 1.7 | 1.62 | 1.7 | | 12 day EMA | 1.83 | 1.83 | 1.9 | | 20 day EMA | 2 | 2.02 | 2.08 | | 35 day EMA | 2.35 | 2.38 | 2.43 | | 50 day EMA | 2.68 | 2.71 | 2.76 |
SMA (simple moving average) of Tallgrass Energy TGE
| SMA period | SMA current | SMA prev | SMA prev2 | | 5 day SMA | 1.64 | 1.61 | 1.69 | | 12 day SMA | 1.86 | 1.87 | 1.91 | | 20 day SMA | 2 | 2.04 | 2.09 | | 35 day SMA | 2.33 | 2.37 | 2.42 | | 50 day SMA | 2.64 | 2.67 | 2.72 | | 100 day SMA | 5.62 | 5.78 | 5.94 | | 150 day SMA | 10.24 | 10.38 | 10.52 | | 200 day SMA | 12.78 | 12.86 | 12.95 |
|
|
