TredegarCorporation TG full analysis,charts,indicators,moving averages,SMA,DMA,EMA,ADX,MACD,RSITredegar Corporation TG WideScreen charts, DMA,SMA,EMA technical analysis, forecast prediction, by indicators ADX,MACD,RSI,CCI NYSE stock exchange
operates under Capital Goods sector & deals in Metal Fabrications
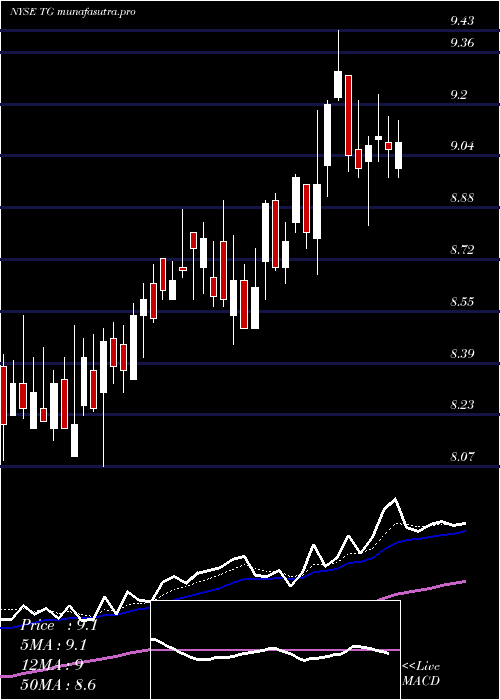
Daily price and charts and targets TredegarCorporation Strong Daily Stock price targets for TredegarCorporation TG are 7.63 and 7.98 | Daily Target 1 | 7.57 | | Daily Target 2 | 7.68 | | Daily Target 3 | 7.9166666666667 | | Daily Target 4 | 8.03 | | Daily Target 5 | 8.27 |
Daily price and volume Tredegar Corporation
| Date |
Closing |
Open |
Range |
Volume |
Thu 04 December 2025 |
7.80 (-4.41%) |
8.15 |
7.80 - 8.15 |
0.4589 times |
Wed 03 December 2025 |
8.16 (3.82%) |
7.94 |
7.85 - 8.17 |
1.8773 times |
Tue 02 December 2025 |
7.86 (-0.88%) |
8.01 |
7.80 - 8.01 |
0.7118 times |
Mon 01 December 2025 |
7.93 (1.67%) |
7.82 |
7.73 - 8.03 |
1.3946 times |
Fri 28 November 2025 |
7.80 (0.39%) |
7.86 |
7.74 - 7.86 |
0.4193 times |
Wed 26 November 2025 |
7.77 (-1.65%) |
7.84 |
7.73 - 7.87 |
0.6596 times |
Tue 25 November 2025 |
7.90 (1.94%) |
7.83 |
7.82 - 7.99 |
0.7275 times |
Mon 24 November 2025 |
7.75 (-1.15%) |
7.81 |
7.68 - 7.86 |
1.0021 times |
Fri 21 November 2025 |
7.84 (0%) |
7.84 |
7.45 - 7.94 |
1.6057 times |
Thu 20 November 2025 |
7.84 (-2%) |
8.19 |
7.82 - 8.26 |
1.1431 times |
Wed 19 November 2025 |
8.00 (-1.23%) |
8.05 |
7.91 - 8.11 |
1.4968 times |
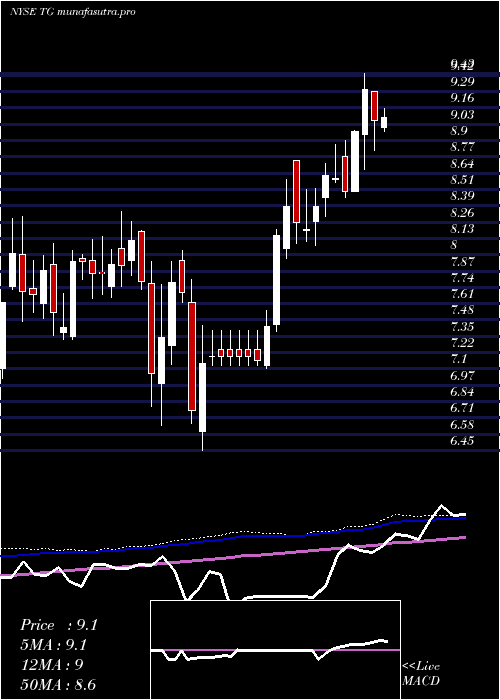
Weekly price and charts TredegarCorporation Strong weekly Stock price targets for TredegarCorporation TG are 7.55 and 7.99 | Weekly Target 1 | 7.46 | | Weekly Target 2 | 7.63 | | Weekly Target 3 | 7.9 | | Weekly Target 4 | 8.07 | | Weekly Target 5 | 8.34 |
Weekly price and volumes for Tredegar Corporation
| Date |
Closing |
Open |
Range |
Volume |
Thu 04 December 2025 |
7.80 (0%) |
7.82 |
7.73 - 8.17 |
0.8394 times |
Fri 28 November 2025 |
7.80 (-0.51%) |
7.81 |
7.68 - 7.99 |
0.5307 times |
Fri 21 November 2025 |
7.84 (-7.87%) |
8.53 |
7.45 - 8.65 |
1.4268 times |
Fri 14 November 2025 |
8.51 (23.87%) |
7.05 |
7.05 - 8.55 |
1.722 times |
Fri 07 November 2025 |
6.87 (-0.58%) |
6.42 |
6.25 - 7.07 |
0.5857 times |
Fri 31 October 2025 |
6.91 (0%) |
6.84 |
6.74 - 6.98 |
0.1485 times |
Fri 31 October 2025 |
6.91 (-7.62%) |
7.53 |
6.66 - 7.64 |
0.6694 times |
Fri 24 October 2025 |
7.48 (2.33%) |
7.32 |
7.04 - 7.54 |
1.0606 times |
Fri 17 October 2025 |
7.31 (-3.43%) |
7.67 |
7.27 - 7.78 |
2.4914 times |
Fri 10 October 2025 |
7.57 (-1.94%) |
7.77 |
7.50 - 7.97 |
0.5256 times |
Fri 03 October 2025 |
7.72 (-3.5%) |
8.02 |
7.60 - 8.20 |
0.7099 times |
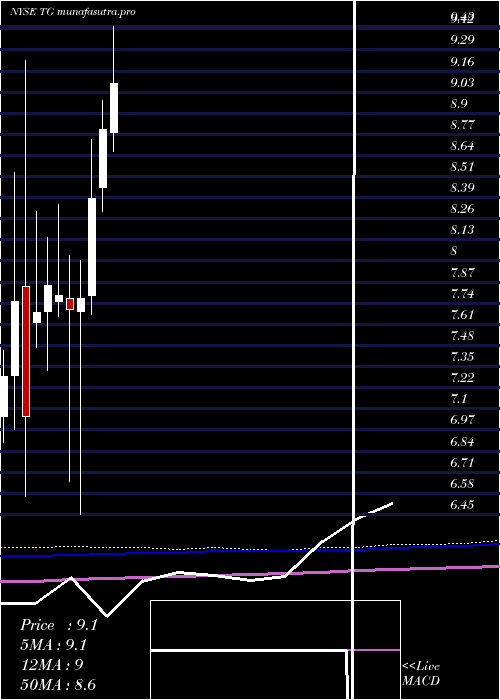
Monthly price and charts TredegarCorporation Strong monthly Stock price targets for TredegarCorporation TG are 7.55 and 7.99 | Monthly Target 1 | 7.46 | | Monthly Target 2 | 7.63 | | Monthly Target 3 | 7.9 | | Monthly Target 4 | 8.07 | | Monthly Target 5 | 8.34 |
Monthly price and volumes Tredegar Corporation
| Date |
Closing |
Open |
Range |
Volume |
Thu 04 December 2025 |
7.80 (0%) |
7.82 |
7.73 - 8.17 |
0.3073 times |
Fri 28 November 2025 |
7.80 (12.88%) |
6.42 |
6.25 - 8.65 |
1.5615 times |
Fri 31 October 2025 |
6.91 (-13.95%) |
8.01 |
6.66 - 8.20 |
1.9164 times |
Tue 30 September 2025 |
8.03 (2.55%) |
7.76 |
7.53 - 8.32 |
1.0262 times |
Fri 29 August 2025 |
7.83 (-10.1%) |
8.50 |
7.04 - 8.53 |
0.9744 times |
Thu 31 July 2025 |
8.71 (-1.02%) |
8.78 |
8.52 - 9.43 |
0.8037 times |
Mon 30 June 2025 |
8.80 (5.01%) |
8.45 |
8.30 - 8.98 |
0.7504 times |
Fri 30 May 2025 |
8.38 (7.85%) |
7.79 |
7.67 - 8.74 |
0.7957 times |
Wed 30 April 2025 |
7.77 (0.91%) |
7.69 |
6.45 - 8.00 |
0.8292 times |
Mon 31 March 2025 |
7.70 (-1.16%) |
7.77 |
6.65 - 8.03 |
1.0353 times |
Fri 28 February 2025 |
7.79 (-0.76%) |
7.75 |
7.66 - 8.34 |
0.7033 times |
DMA SMA EMA moving averages of Tredegar Corporation TG
DMA (daily moving average) of Tredegar Corporation TG
| DMA period | DMA value | | 5 day DMA | 7.91 | | 12 day DMA | 7.9 | | 20 day DMA | 7.9 | | 35 day DMA | 7.57 | | 50 day DMA | 7.64 | | 100 day DMA | 7.86 | | 150 day DMA | 8.1 | | 200 day DMA | 7.92 | EMA (exponential moving average) of Tredegar Corporation TG
| EMA period | EMA current | EMA prev | EMA prev2 | | 5 day EMA | 7.91 | 7.97 | 7.87 | | 12 day EMA | 7.88 | 7.9 | 7.85 | | 20 day EMA | 7.83 | 7.83 | 7.79 | | 35 day EMA | 7.8 | 7.8 | 7.78 | | 50 day EMA | 7.7 | 7.7 | 7.68 |
SMA (simple moving average) of Tredegar Corporation TG
| SMA period | SMA current | SMA prev | SMA prev2 | | 5 day SMA | 7.91 | 7.9 | 7.85 | | 12 day SMA | 7.9 | 7.95 | 7.98 | | 20 day SMA | 7.9 | 7.83 | 7.74 | | 35 day SMA | 7.57 | 7.56 | 7.55 | | 50 day SMA | 7.64 | 7.64 | 7.64 | | 100 day SMA | 7.86 | 7.87 | 7.88 | | 150 day SMA | 8.1 | 8.1 | 8.1 | | 200 day SMA | 7.92 | 7.92 | 7.92 |
|
|
