TeleflexIncorporated TFX full analysis,charts,indicators,moving averages,SMA,DMA,EMA,ADX,MACD,RSITeleflex Incorporated TFX WideScreen charts, DMA,SMA,EMA technical analysis, forecast prediction, by indicators ADX,MACD,RSI,CCI NYSE stock exchange
operates under Health Care sector & deals in Medical Dental Instruments
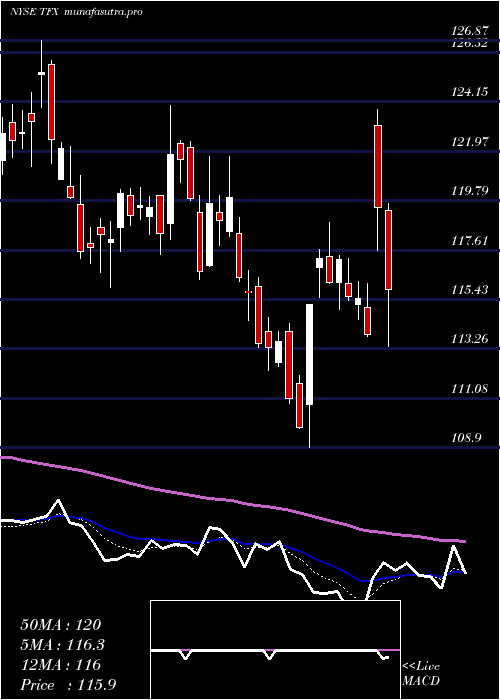
Daily price and charts and targets TeleflexIncorporated Strong Daily Stock price targets for TeleflexIncorporated TFX are 117.09 and 119.2 | Daily Target 1 | 116.49 | | Daily Target 2 | 117.68 | | Daily Target 3 | 118.60333333333 | | Daily Target 4 | 119.79 | | Daily Target 5 | 120.71 |
Daily price and volume Teleflex Incorporated
| Date |
Closing |
Open |
Range |
Volume |
Thu 04 December 2025 |
118.86 (-0.22%) |
119.13 |
117.42 - 119.53 |
0.7001 times |
Wed 03 December 2025 |
119.12 (2.54%) |
116.91 |
115.51 - 119.15 |
1.3458 times |
Tue 02 December 2025 |
116.17 (1.54%) |
114.94 |
113.62 - 117.89 |
1.3903 times |
Mon 01 December 2025 |
114.41 (-0.01%) |
113.97 |
113.64 - 117.16 |
1.0793 times |
Fri 28 November 2025 |
114.42 (-0.75%) |
114.79 |
112.50 - 116.01 |
0.458 times |
Wed 26 November 2025 |
115.29 (0.51%) |
114.08 |
113.81 - 117.14 |
1.1627 times |
Tue 25 November 2025 |
114.70 (2.97%) |
112.16 |
112.11 - 115.78 |
1.1401 times |
Mon 24 November 2025 |
111.39 (1.05%) |
109.96 |
107.79 - 112.05 |
0.8759 times |
Fri 21 November 2025 |
110.23 (5.34%) |
105.23 |
104.86 - 110.79 |
0.8956 times |
Thu 20 November 2025 |
104.64 (-1%) |
105.87 |
104.21 - 107.29 |
0.952 times |
Wed 19 November 2025 |
105.70 (-1.65%) |
107.64 |
104.46 - 108.55 |
0.9403 times |
Weekly price and charts TeleflexIncorporated Strong weekly Stock price targets for TeleflexIncorporated TFX are 116.24 and 122.15 | Weekly Target 1 | 111.43 | | Weekly Target 2 | 115.14 | | Weekly Target 3 | 117.33666666667 | | Weekly Target 4 | 121.05 | | Weekly Target 5 | 123.25 |
Weekly price and volumes for Teleflex Incorporated
| Date |
Closing |
Open |
Range |
Volume |
Thu 04 December 2025 |
118.86 (3.88%) |
113.97 |
113.62 - 119.53 |
1.014 times |
Fri 28 November 2025 |
114.42 (3.8%) |
109.96 |
107.79 - 117.14 |
0.8167 times |
Fri 21 November 2025 |
110.23 (3.02%) |
106.76 |
103.10 - 110.79 |
1.2784 times |
Fri 14 November 2025 |
107.00 (-2.19%) |
110.00 |
105.10 - 114.20 |
1.2669 times |
Fri 07 November 2025 |
109.40 (-12.11%) |
123.46 |
102.58 - 126.00 |
2.1319 times |
Fri 31 October 2025 |
124.47 (0%) |
124.73 |
122.82 - 124.91 |
0.1228 times |
Fri 31 October 2025 |
124.47 (-5.64%) |
132.20 |
122.82 - 133.29 |
0.8081 times |
Fri 24 October 2025 |
131.91 (2.95%) |
128.49 |
128.49 - 135.96 |
0.7927 times |
Fri 17 October 2025 |
128.13 (7.29%) |
119.71 |
118.45 - 128.92 |
0.8916 times |
Fri 10 October 2025 |
119.42 (-8.77%) |
131.54 |
118.97 - 131.54 |
0.8769 times |
Fri 03 October 2025 |
130.90 (9.09%) |
120.41 |
119.11 - 131.80 |
1.0479 times |

Monthly price and charts TeleflexIncorporated Strong monthly Stock price targets for TeleflexIncorporated TFX are 116.24 and 122.15 | Monthly Target 1 | 111.43 | | Monthly Target 2 | 115.14 | | Monthly Target 3 | 117.33666666667 | | Monthly Target 4 | 121.05 | | Monthly Target 5 | 123.25 |
Monthly price and volumes Teleflex Incorporated
| Date |
Closing |
Open |
Range |
Volume |
Thu 04 December 2025 |
118.86 (3.88%) |
113.97 |
113.62 - 119.53 |
0.1815 times |
Fri 28 November 2025 |
114.42 (-8.07%) |
123.46 |
102.58 - 126.00 |
0.9833 times |
Fri 31 October 2025 |
124.47 (1.72%) |
122.73 |
118.45 - 135.96 |
0.7418 times |
Tue 30 September 2025 |
122.36 (-3.2%) |
125.44 |
115.73 - 133.18 |
1.0331 times |
Fri 29 August 2025 |
126.41 (5.78%) |
119.35 |
111.91 - 129.76 |
0.8538 times |
Thu 31 July 2025 |
119.50 (0.96%) |
118.77 |
108.90 - 123.97 |
0.9045 times |
Mon 30 June 2025 |
118.36 (-3.2%) |
121.71 |
115.94 - 126.87 |
0.7459 times |
Fri 30 May 2025 |
122.27 (-10.78%) |
132.93 |
119.08 - 135.75 |
0.814 times |
Wed 30 April 2025 |
137.05 (-0.82%) |
139.08 |
124.66 - 141.91 |
1.3303 times |
Mon 31 March 2025 |
138.19 (4.1%) |
134.21 |
128.55 - 143.32 |
2.4119 times |
Fri 28 February 2025 |
132.75 (-26.35%) |
179.02 |
130.60 - 180.58 |
1.3813 times |

DMA SMA EMA moving averages of Teleflex Incorporated TFX
DMA (daily moving average) of Teleflex Incorporated TFX
| DMA period | DMA value | | 5 day DMA | 116.6 | | 12 day DMA | 112.7 | | 20 day DMA | 111.12 | | 35 day DMA | 118.55 | | 50 day DMA | 120.01 | | 100 day DMA | 121.04 | | 150 day DMA | 121.28 | | 200 day DMA | 125.96 | EMA (exponential moving average) of Teleflex Incorporated TFX
| EMA period | EMA current | EMA prev | EMA prev2 | | 5 day EMA | 116.93 | 115.96 | 114.38 | | 12 day EMA | 114.72 | 113.97 | 113.03 | | 20 day EMA | 114.88 | 114.46 | 113.97 | | 35 day EMA | 116.46 | 116.32 | 116.15 | | 50 day EMA | 119.95 | 119.99 | 120.03 |
SMA (simple moving average) of Teleflex Incorporated TFX
| SMA period | SMA current | SMA prev | SMA prev2 | | 5 day SMA | 116.6 | 115.88 | 115 | | 12 day SMA | 112.7 | 111.45 | 110.44 | | 20 day SMA | 111.12 | 111.41 | 111.68 | | 35 day SMA | 118.55 | 118.62 | 118.71 | | 50 day SMA | 120.01 | 120.1 | 120.16 | | 100 day SMA | 121.04 | 120.98 | 120.95 | | 150 day SMA | 121.28 | 121.4 | 121.53 | | 200 day SMA | 125.96 | 126.21 | 126.45 |
|
|
