TfiInternational TFII full analysis,charts,indicators,moving averages,SMA,DMA,EMA,ADX,MACD,RSITfi International TFII WideScreen charts, DMA,SMA,EMA technical analysis, forecast prediction, by indicators ADX,MACD,RSI,CCI NYSE stock exchange
Daily price and charts and targets TfiInternational Strong Daily Stock price targets for TfiInternational TFII are 95.69 and 98.09 | Daily Target 1 | 93.89 | | Daily Target 2 | 95.09 | | Daily Target 3 | 96.293333333333 | | Daily Target 4 | 97.49 | | Daily Target 5 | 98.69 |
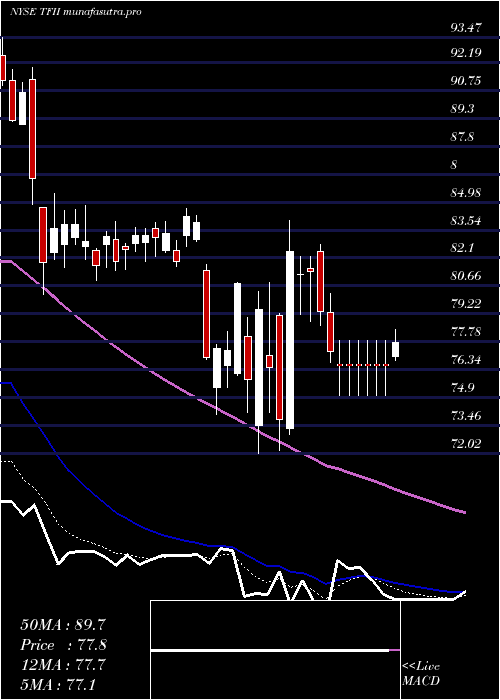
Daily price and volume Tfi International
| Date |
Closing |
Open |
Range |
Volume |
Mon 20 October 2025 |
96.28 (1.83%) |
95.10 |
95.10 - 97.50 |
1.0969 times |
Fri 17 October 2025 |
94.55 (-0.8%) |
93.92 |
93.23 - 96.00 |
1.7785 times |
Thu 16 October 2025 |
95.31 (7.09%) |
90.31 |
89.56 - 95.46 |
2.2589 times |
Wed 15 October 2025 |
89.00 (-0.45%) |
90.00 |
88.77 - 91.14 |
0.748 times |
Tue 14 October 2025 |
89.40 (1.38%) |
86.58 |
86.58 - 89.56 |
0.802 times |
Mon 13 October 2025 |
88.18 (-2.87%) |
88.93 |
87.41 - 89.26 |
0.5942 times |
Tue 07 October 2025 |
90.79 (-2.52%) |
92.66 |
90.31 - 93.46 |
0.9796 times |
Mon 06 October 2025 |
93.14 (2.17%) |
91.49 |
89.83 - 94.36 |
0.4998 times |
Fri 03 October 2025 |
91.16 (1.76%) |
89.70 |
89.54 - 92.03 |
0.7449 times |
Thu 02 October 2025 |
89.58 (0.9%) |
89.17 |
88.83 - 90.24 |
0.4972 times |
Wed 01 October 2025 |
88.78 (0.82%) |
87.52 |
87.52 - 89.09 |
0.9352 times |
Weekly price and charts TfiInternational Strong weekly Stock price targets for TfiInternational TFII are 95.69 and 98.09 | Weekly Target 1 | 93.89 | | Weekly Target 2 | 95.09 | | Weekly Target 3 | 96.293333333333 | | Weekly Target 4 | 97.49 | | Weekly Target 5 | 98.69 |
Weekly price and volumes for Tfi International
| Date |
Closing |
Open |
Range |
Volume |
Mon 20 October 2025 |
96.28 (1.83%) |
95.10 |
95.10 - 97.50 |
0.2641 times |
Fri 17 October 2025 |
94.55 (4.14%) |
88.93 |
86.58 - 96.00 |
1.4883 times |
Tue 07 October 2025 |
90.79 (-0.41%) |
91.49 |
89.83 - 94.36 |
0.3562 times |
Fri 03 October 2025 |
91.16 (2.66%) |
89.26 |
86.56 - 92.03 |
0.8624 times |
Fri 26 September 2025 |
88.80 (-4.98%) |
93.33 |
88.39 - 94.65 |
1.4193 times |
Fri 19 September 2025 |
93.45 (-0.19%) |
94.10 |
92.97 - 97.14 |
1.7708 times |
Fri 12 September 2025 |
93.63 (-2.93%) |
96.67 |
90.74 - 96.67 |
1.1654 times |
Fri 05 September 2025 |
96.46 (1.74%) |
93.75 |
93.09 - 99.41 |
1.2485 times |
Fri 29 August 2025 |
94.81 (0%) |
94.00 |
93.69 - 95.16 |
0.2706 times |
Fri 29 August 2025 |
94.81 (-2.05%) |
96.40 |
92.60 - 96.79 |
1.1544 times |
Fri 22 August 2025 |
96.79 (6.75%) |
90.65 |
89.80 - 98.14 |
2.0577 times |
Monthly price and charts TfiInternational Strong monthly Stock price targets for TfiInternational TFII are 91.43 and 102.35 | Monthly Target 1 | 82.53 | | Monthly Target 2 | 89.41 | | Monthly Target 3 | 93.453333333333 | | Monthly Target 4 | 100.33 | | Monthly Target 5 | 104.37 |
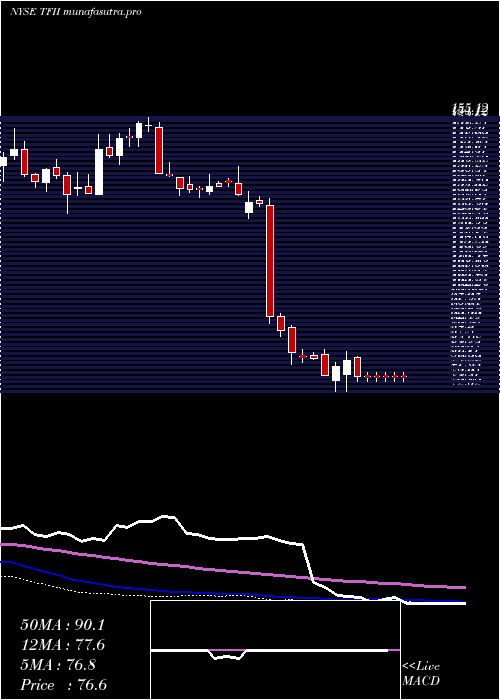
Monthly price and volumes Tfi International
| Date |
Closing |
Open |
Range |
Volume |
Mon 20 October 2025 |
96.28 (9.33%) |
87.52 |
86.58 - 97.50 |
0.3061 times |
Tue 30 September 2025 |
88.06 (-7.12%) |
93.75 |
86.56 - 99.41 |
0.6908 times |
Fri 29 August 2025 |
94.81 (8.76%) |
86.17 |
83.43 - 98.14 |
0.7954 times |
Thu 31 July 2025 |
87.17 (-2.79%) |
89.60 |
86.58 - 95.89 |
1.208 times |
Mon 30 June 2025 |
89.67 (4.23%) |
86.14 |
84.31 - 92.46 |
1.0253 times |
Fri 30 May 2025 |
86.03 (5.78%) |
82.10 |
79.50 - 92.51 |
1.3028 times |
Wed 30 April 2025 |
81.33 (5.01%) |
76.56 |
72.02 - 84.53 |
1.4307 times |
Mon 31 March 2025 |
77.45 (-14.56%) |
91.32 |
74.01 - 91.94 |
1.5055 times |
Fri 28 February 2025 |
90.65 (-31.23%) |
126.40 |
88.76 - 132.74 |
1.2167 times |
Fri 31 January 2025 |
131.81 (-2.43%) |
135.70 |
130.81 - 140.35 |
0.5187 times |
Tue 31 December 2024 |
135.09 (-9.48%) |
153.31 |
134.10 - 155.12 |
0.4804 times |

DMA SMA EMA moving averages of Tfi International TFII
DMA (daily moving average) of Tfi International TFII
| DMA period | DMA value | | 5 day DMA | 92.91 | | 12 day DMA | 91.19 | | 20 day DMA | 91.37 | | 35 day DMA | 92.77 | | 50 day DMA | 92.25 | | 100 day DMA | 90.73 | | 150 day DMA | 87.65 | | 200 day DMA | 95.34 | EMA (exponential moving average) of Tfi International TFII
| EMA period | EMA current | EMA prev | EMA prev2 | | 5 day EMA | 93.76 | 92.5 | 91.47 | | 12 day EMA | 92.27 | 91.54 | 90.99 | | 20 day EMA | 91.98 | 91.53 | 91.21 | | 35 day EMA | 91.7 | 91.43 | 91.25 | | 50 day EMA | 91.97 | 91.79 | 91.68 |
SMA (simple moving average) of Tfi International TFII
| SMA period | SMA current | SMA prev | SMA prev2 | | 5 day SMA | 92.91 | 91.29 | 90.54 | | 12 day SMA | 91.19 | 90.61 | 90.13 | | 20 day SMA | 91.37 | 91.24 | 91.29 | | 35 day SMA | 92.77 | 92.7 | 92.69 | | 50 day SMA | 92.25 | 92.11 | 91.99 | | 100 day SMA | 90.73 | 90.64 | 90.59 | | 150 day SMA | 87.65 | 87.56 | 87.48 | | 200 day SMA | 95.34 | 95.54 | 95.74 |
|
|
