TruistFinancial TFC-O full analysis,charts,indicators,moving averages,SMA,DMA,EMA,ADX,MACD,RSITruist Financial TFC-O WideScreen charts, DMA,SMA,EMA technical analysis, forecast prediction, by indicators ADX,MACD,RSI,CCI NYSE stock exchange
Daily price and charts and targets TruistFinancial Strong Daily Stock price targets for TruistFinancial TFC-O are 22.92 and 23.09 | Daily Target 1 | 22.78 | | Daily Target 2 | 22.88 | | Daily Target 3 | 22.953333333333 | | Daily Target 4 | 23.05 | | Daily Target 5 | 23.12 |
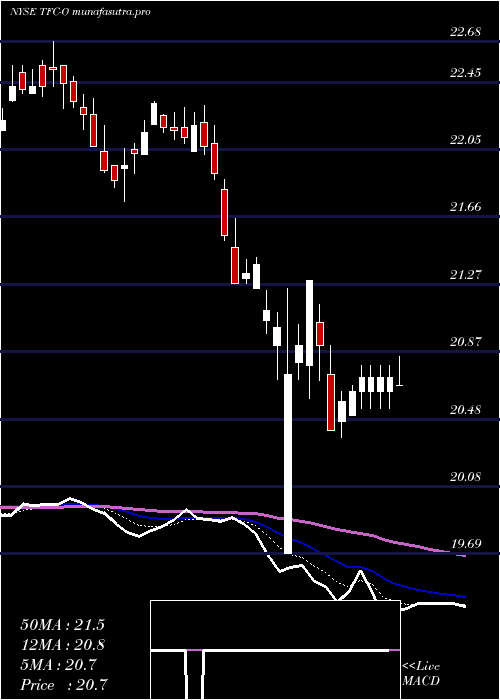
Daily price and volume Truist Financial
| Date |
Closing |
Open |
Range |
Volume |
Mon 20 October 2025 |
22.97 (0.83%) |
22.95 |
22.86 - 23.03 |
0.4924 times |
Fri 17 October 2025 |
22.78 (0.04%) |
22.85 |
22.62 - 22.85 |
3.5991 times |
Thu 16 October 2025 |
22.77 (-1.17%) |
23.04 |
22.77 - 23.17 |
1.1122 times |
Wed 15 October 2025 |
23.04 (0.48%) |
23.07 |
22.96 - 23.16 |
0.8648 times |
Tue 14 October 2025 |
22.93 (0.09%) |
22.83 |
22.81 - 23.05 |
0.6398 times |
Mon 13 October 2025 |
22.91 (0.61%) |
22.88 |
22.78 - 22.99 |
0.5224 times |
Fri 10 October 2025 |
22.77 (-0.78%) |
23.03 |
22.74 - 23.05 |
0.6573 times |
Thu 09 October 2025 |
22.95 (-0.56%) |
23.14 |
22.85 - 23.17 |
1.1272 times |
Wed 08 October 2025 |
23.08 (-0.17%) |
23.10 |
23.08 - 23.19 |
0.4624 times |
Tue 07 October 2025 |
23.12 (-0.22%) |
23.16 |
23.08 - 23.28 |
0.5224 times |
Mon 06 October 2025 |
23.17 (-0.34%) |
23.15 |
23.15 - 23.26 |
0.4174 times |
Weekly price and charts TruistFinancial Strong weekly Stock price targets for TruistFinancial TFC-O are 22.92 and 23.09 | Weekly Target 1 | 22.78 | | Weekly Target 2 | 22.88 | | Weekly Target 3 | 22.953333333333 | | Weekly Target 4 | 23.05 | | Weekly Target 5 | 23.12 |
Weekly price and volumes for Truist Financial
| Date |
Closing |
Open |
Range |
Volume |
Mon 20 October 2025 |
22.97 (0.83%) |
22.95 |
22.86 - 23.03 |
0.1238 times |
Fri 17 October 2025 |
22.78 (0.04%) |
22.88 |
22.62 - 23.17 |
1.6942 times |
Fri 10 October 2025 |
22.77 (-2.06%) |
23.15 |
22.74 - 23.28 |
0.8012 times |
Fri 03 October 2025 |
23.25 (1.4%) |
22.96 |
22.82 - 23.34 |
0.9464 times |
Fri 26 September 2025 |
22.93 (-1.12%) |
23.23 |
22.80 - 23.25 |
0.8792 times |
Fri 19 September 2025 |
23.19 (0.04%) |
23.23 |
23.00 - 23.47 |
1.0771 times |
Fri 12 September 2025 |
23.18 (3.3%) |
22.54 |
22.39 - 23.18 |
1.1619 times |
Fri 05 September 2025 |
22.44 (3.17%) |
21.78 |
21.68 - 22.51 |
0.8458 times |
Fri 29 August 2025 |
21.75 (0%) |
21.98 |
21.75 - 22.06 |
0.8666 times |
Fri 29 August 2025 |
21.75 (-1.23%) |
22.07 |
21.75 - 22.13 |
1.6037 times |
Fri 22 August 2025 |
22.02 (1.8%) |
21.57 |
21.57 - 22.09 |
1.7709 times |

Monthly price and charts TruistFinancial Strong monthly Stock price targets for TruistFinancial TFC-O are 22.44 and 23.16 | Monthly Target 1 | 22.26 | | Monthly Target 2 | 22.61 | | Monthly Target 3 | 22.976666666667 | | Monthly Target 4 | 23.33 | | Monthly Target 5 | 23.7 |
Monthly price and volumes Truist Financial
| Date |
Closing |
Open |
Range |
Volume |
Mon 20 October 2025 |
22.97 (-0.43%) |
23.01 |
22.62 - 23.34 |
0.4928 times |
Tue 30 September 2025 |
23.07 (6.07%) |
21.78 |
21.68 - 23.47 |
0.7619 times |
Fri 29 August 2025 |
21.75 (0.18%) |
21.66 |
21.36 - 22.13 |
1.0991 times |
Thu 31 July 2025 |
21.71 (3.53%) |
21.01 |
20.75 - 21.74 |
1.0171 times |
Mon 30 June 2025 |
20.97 (0.62%) |
20.83 |
20.61 - 21.22 |
0.9393 times |
Fri 30 May 2025 |
20.84 (-0.81%) |
21.04 |
20.48 - 21.46 |
1.1767 times |
Wed 30 April 2025 |
21.01 (-1.22%) |
21.30 |
19.69 - 21.42 |
1.0537 times |
Mon 31 March 2025 |
21.27 (-5.13%) |
22.53 |
21.27 - 22.68 |
0.9626 times |
Fri 28 February 2025 |
22.42 (-0.36%) |
22.40 |
22.11 - 22.81 |
0.7248 times |
Fri 31 January 2025 |
22.50 (6.79%) |
21.27 |
21.02 - 23.05 |
1.7721 times |
Tue 31 December 2024 |
21.07 (-7.55%) |
22.59 |
20.75 - 22.94 |
2.1641 times |

DMA SMA EMA moving averages of Truist Financial TFC-O
DMA (daily moving average) of Truist Financial TFC-O
| DMA period | DMA value | | 5 day DMA | 22.9 | | 12 day DMA | 22.98 | | 20 day DMA | 23.02 | | 35 day DMA | 22.9 | | 50 day DMA | 22.56 | | 100 day DMA | 21.9 | | 150 day DMA | 21.64 | | 200 day DMA | 21.8 | EMA (exponential moving average) of Truist Financial TFC-O
| EMA period | EMA current | EMA prev | EMA prev2 | | 5 day EMA | 22.9 | 22.86 | 22.9 | | 12 day EMA | 22.94 | 22.94 | 22.97 | | 20 day EMA | 22.92 | 22.92 | 22.94 | | 35 day EMA | 22.74 | 22.73 | 22.73 | | 50 day EMA | 22.53 | 22.51 | 22.5 |
SMA (simple moving average) of Truist Financial TFC-O
| SMA period | SMA current | SMA prev | SMA prev2 | | 5 day SMA | 22.9 | 22.89 | 22.88 | | 12 day SMA | 22.98 | 23.01 | 23.03 | | 20 day SMA | 23.02 | 23.04 | 23.06 | | 35 day SMA | 22.9 | 22.86 | 22.84 | | 50 day SMA | 22.56 | 22.53 | 22.51 | | 100 day SMA | 21.9 | 21.88 | 21.85 | | 150 day SMA | 21.64 | 21.64 | 21.63 | | 200 day SMA | 21.8 | 21.79 | 21.78 |
|
|
