TruistFinancial TFC-I full analysis,charts,indicators,moving averages,SMA,DMA,EMA,ADX,MACD,RSITruist Financial TFC-I WideScreen charts, DMA,SMA,EMA technical analysis, forecast prediction, by indicators ADX,MACD,RSI,CCI NYSE stock exchange
Daily price and charts and targets TruistFinancial Strong Daily Stock price targets for TruistFinancial TFC-I are 22.19 and 22.49 | Daily Target 1 | 21.96 | | Daily Target 2 | 22.12 | | Daily Target 3 | 22.256666666667 | | Daily Target 4 | 22.42 | | Daily Target 5 | 22.56 |
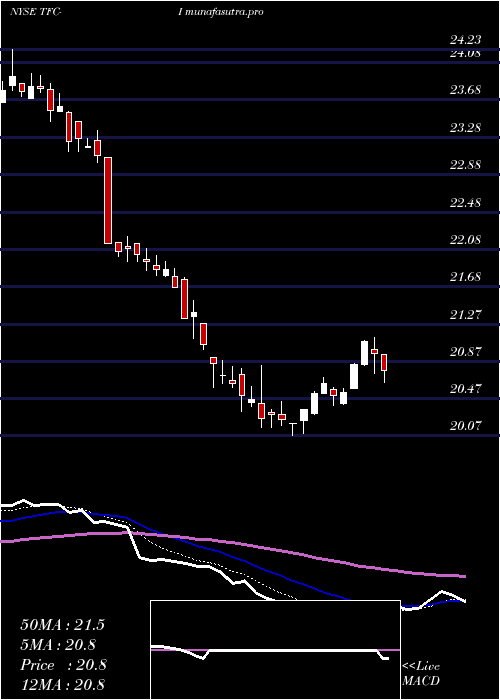
Daily price and volume Truist Financial
| Date |
Closing |
Open |
Range |
Volume |
Mon 20 October 2025 |
22.29 (1.32%) |
22.20 |
22.09 - 22.39 |
0.5684 times |
Fri 17 October 2025 |
22.00 (1.85%) |
21.70 |
21.65 - 22.29 |
3.9008 times |
Thu 16 October 2025 |
21.60 (-0.92%) |
21.86 |
21.60 - 21.98 |
0.3399 times |
Wed 15 October 2025 |
21.80 (0.79%) |
21.68 |
21.68 - 21.91 |
0.6325 times |
Tue 14 October 2025 |
21.63 (-1.55%) |
21.92 |
21.62 - 21.97 |
0.6408 times |
Mon 13 October 2025 |
21.97 (-0.59%) |
22.08 |
21.97 - 22.33 |
0.8442 times |
Fri 10 October 2025 |
22.10 (-0.67%) |
22.37 |
22.01 - 22.37 |
0.5461 times |
Thu 09 October 2025 |
22.25 (-0.09%) |
22.40 |
22.14 - 22.50 |
0.7718 times |
Wed 08 October 2025 |
22.27 (-0.54%) |
22.39 |
22.25 - 22.45 |
1.2176 times |
Tue 07 October 2025 |
22.39 (-0.18%) |
22.57 |
22.22 - 22.57 |
0.5378 times |
Mon 06 October 2025 |
22.43 (0.58%) |
22.45 |
22.24 - 22.70 |
0.3065 times |
Weekly price and charts TruistFinancial Strong weekly Stock price targets for TruistFinancial TFC-I are 22.19 and 22.49 | Weekly Target 1 | 21.96 | | Weekly Target 2 | 22.12 | | Weekly Target 3 | 22.256666666667 | | Weekly Target 4 | 22.42 | | Weekly Target 5 | 22.56 |
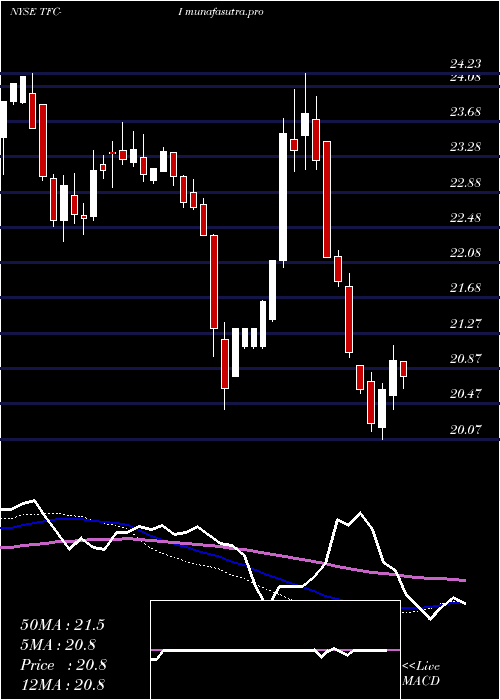
Weekly price and volumes for Truist Financial
| Date |
Closing |
Open |
Range |
Volume |
Mon 20 October 2025 |
22.29 (1.32%) |
22.20 |
22.09 - 22.39 |
0.1558 times |
Fri 17 October 2025 |
22.00 (-0.45%) |
22.08 |
21.60 - 22.33 |
1.7426 times |
Fri 10 October 2025 |
22.10 (-0.9%) |
22.45 |
22.01 - 22.70 |
0.9263 times |
Fri 03 October 2025 |
22.30 (-0.22%) |
22.40 |
22.20 - 22.82 |
2.8751 times |
Fri 26 September 2025 |
22.35 (-0.18%) |
21.90 |
21.90 - 22.58 |
0.6835 times |
Fri 19 September 2025 |
22.39 (2.42%) |
21.86 |
21.75 - 22.43 |
0.7392 times |
Fri 12 September 2025 |
21.86 (2.39%) |
21.39 |
21.32 - 21.94 |
0.7209 times |
Fri 05 September 2025 |
21.35 (2.3%) |
20.81 |
20.80 - 21.43 |
0.5323 times |
Fri 29 August 2025 |
20.87 (0%) |
20.95 |
20.80 - 20.97 |
0.3658 times |
Fri 29 August 2025 |
20.87 (-1.46%) |
21.10 |
20.80 - 21.13 |
1.2585 times |
Fri 22 August 2025 |
21.18 (1.19%) |
20.88 |
20.83 - 21.30 |
0.7973 times |
Monthly price and charts TruistFinancial Strong monthly Stock price targets for TruistFinancial TFC-I are 21.39 and 22.5 | Monthly Target 1 | 21.09 | | Monthly Target 2 | 21.69 | | Monthly Target 3 | 22.2 | | Monthly Target 4 | 22.8 | | Monthly Target 5 | 23.31 |
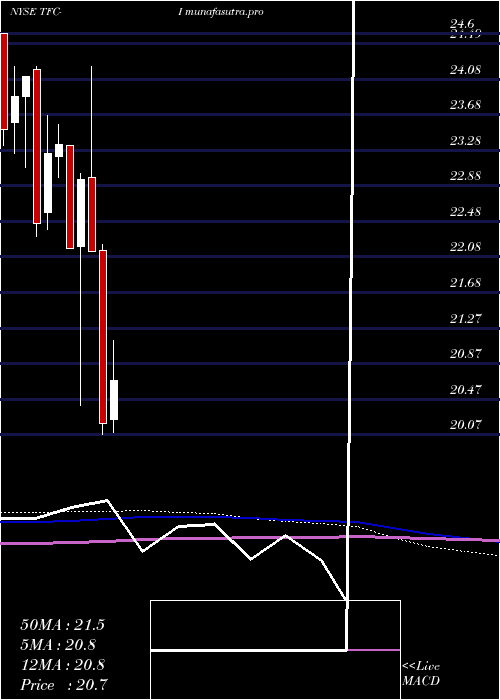
Monthly price and volumes Truist Financial
| Date |
Closing |
Open |
Range |
Volume |
Mon 20 October 2025 |
22.29 (-2.02%) |
22.67 |
21.60 - 22.71 |
0.9016 times |
Tue 30 September 2025 |
22.75 (9.01%) |
20.81 |
20.80 - 22.82 |
1.57 times |
Fri 29 August 2025 |
20.87 (0.68%) |
20.71 |
20.57 - 21.30 |
1.1779 times |
Thu 31 July 2025 |
20.73 (2.62%) |
20.24 |
20.10 - 21.13 |
1.4668 times |
Mon 30 June 2025 |
20.20 (-8.76%) |
22.15 |
20.07 - 22.22 |
1.5132 times |
Fri 30 May 2025 |
22.14 (-3.53%) |
22.97 |
22.14 - 24.23 |
1.4896 times |
Wed 30 April 2025 |
22.95 (3.52%) |
22.20 |
20.40 - 23.02 |
0.7339 times |
Mon 31 March 2025 |
22.17 (-5.01%) |
23.33 |
22.17 - 23.33 |
0.4241 times |
Fri 28 February 2025 |
23.34 (0.39%) |
23.21 |
22.97 - 23.57 |
0.3162 times |
Fri 31 January 2025 |
23.25 (3.56%) |
22.58 |
22.39 - 23.67 |
0.4066 times |
Tue 31 December 2024 |
22.45 (-6.89%) |
24.19 |
22.31 - 24.23 |
0.5846 times |
DMA SMA EMA moving averages of Truist Financial TFC-I
DMA (daily moving average) of Truist Financial TFC-I
| DMA period | DMA value | | 5 day DMA | 21.86 | | 12 day DMA | 22.09 | | 20 day DMA | 22.23 | | 35 day DMA | 21.99 | | 50 day DMA | 21.68 | | 100 day DMA | 21.38 | | 150 day DMA | 21.74 | | 200 day DMA | 22.09 | EMA (exponential moving average) of Truist Financial TFC-I
| EMA period | EMA current | EMA prev | EMA prev2 | | 5 day EMA | 22.01 | 21.87 | 21.81 | | 12 day EMA | 22.06 | 22.02 | 22.02 | | 20 day EMA | 22.05 | 22.03 | 22.03 | | 35 day EMA | 21.88 | 21.86 | 21.85 | | 50 day EMA | 21.65 | 21.62 | 21.6 |
SMA (simple moving average) of Truist Financial TFC-I
| SMA period | SMA current | SMA prev | SMA prev2 | | 5 day SMA | 21.86 | 21.8 | 21.82 | | 12 day SMA | 22.09 | 22.11 | 22.17 | | 20 day SMA | 22.23 | 22.24 | 22.25 | | 35 day SMA | 21.99 | 21.95 | 21.92 | | 50 day SMA | 21.68 | 21.65 | 21.63 | | 100 day SMA | 21.38 | 21.39 | 21.4 | | 150 day SMA | 21.74 | 21.75 | 21.75 | | 200 day SMA | 22.09 | 22.09 | 22.09 |
|
|
