TruistFinancial TFC full analysis,charts,indicators,moving averages,SMA,DMA,EMA,ADX,MACD,RSITruist Financial TFC WideScreen charts, DMA,SMA,EMA technical analysis, forecast prediction, by indicators ADX,MACD,RSI,CCI NYSE stock exchange
Daily price and charts and targets TruistFinancial Strong Daily Stock price targets for TruistFinancial TFC are 47.43 and 47.98 | Daily Target 1 | 47.02 | | Daily Target 2 | 47.28 | | Daily Target 3 | 47.57 | | Daily Target 4 | 47.83 | | Daily Target 5 | 48.12 |
Daily price and volume Truist Financial
| Date |
Closing |
Open |
Range |
Volume |
Thu 04 December 2025 |
47.54 (0.25%) |
47.41 |
47.31 - 47.86 |
1.2024 times |
Wed 03 December 2025 |
47.42 (2.02%) |
46.50 |
46.48 - 47.46 |
0.8347 times |
Tue 02 December 2025 |
46.48 (-0.19%) |
46.75 |
46.31 - 46.75 |
0.7085 times |
Mon 01 December 2025 |
46.57 (0.15%) |
46.49 |
46.37 - 47.10 |
1.3633 times |
Fri 28 November 2025 |
46.50 (0.56%) |
46.41 |
46.21 - 46.64 |
0.5995 times |
Wed 26 November 2025 |
46.24 (-0.17%) |
46.22 |
46.22 - 46.66 |
0.9134 times |
Tue 25 November 2025 |
46.32 (1.82%) |
45.75 |
45.67 - 46.59 |
1.1556 times |
Mon 24 November 2025 |
45.49 (0.02%) |
45.50 |
45.16 - 45.73 |
0.5575 times |
Fri 21 November 2025 |
45.48 (2.43%) |
44.61 |
44.57 - 45.96 |
1.4093 times |
Thu 20 November 2025 |
44.40 (-0.56%) |
45.00 |
44.30 - 45.78 |
1.2557 times |
Wed 19 November 2025 |
44.65 (0.7%) |
44.41 |
44.24 - 44.74 |
0.9151 times |
Weekly price and charts TruistFinancial Strong weekly Stock price targets for TruistFinancial TFC are 46.93 and 48.48 | Weekly Target 1 | 45.69 | | Weekly Target 2 | 46.61 | | Weekly Target 3 | 47.236666666667 | | Weekly Target 4 | 48.16 | | Weekly Target 5 | 48.79 |
Weekly price and volumes for Truist Financial
| Date |
Closing |
Open |
Range |
Volume |
Thu 04 December 2025 |
47.54 (2.24%) |
46.49 |
46.31 - 47.86 |
0.8076 times |
Fri 28 November 2025 |
46.50 (2.24%) |
45.50 |
45.16 - 46.66 |
0.6341 times |
Fri 21 November 2025 |
45.48 (1.38%) |
44.86 |
43.58 - 45.96 |
1.189 times |
Fri 14 November 2025 |
44.86 (0.27%) |
44.88 |
44.21 - 46.29 |
1.1604 times |
Fri 07 November 2025 |
44.74 (0.25%) |
43.92 |
43.37 - 44.74 |
1.0516 times |
Fri 31 October 2025 |
44.63 (0%) |
44.19 |
43.91 - 44.75 |
0.1863 times |
Fri 31 October 2025 |
44.63 (1%) |
44.40 |
43.66 - 44.94 |
1.1778 times |
Fri 24 October 2025 |
44.19 (4%) |
43.11 |
42.70 - 44.50 |
1.0595 times |
Fri 17 October 2025 |
42.49 (0.43%) |
43.00 |
40.05 - 44.24 |
1.6259 times |
Fri 10 October 2025 |
42.31 (-7.05%) |
45.89 |
42.30 - 46.37 |
1.1077 times |
Fri 03 October 2025 |
45.52 (-1.09%) |
46.33 |
44.79 - 46.33 |
0.9788 times |
Monthly price and charts TruistFinancial Strong monthly Stock price targets for TruistFinancial TFC are 46.93 and 48.48 | Monthly Target 1 | 45.69 | | Monthly Target 2 | 46.61 | | Monthly Target 3 | 47.236666666667 | | Monthly Target 4 | 48.16 | | Monthly Target 5 | 48.79 |
Monthly price and volumes Truist Financial
| Date |
Closing |
Open |
Range |
Volume |
Thu 04 December 2025 |
47.54 (2.24%) |
46.49 |
46.31 - 47.86 |
0.1678 times |
Fri 28 November 2025 |
46.50 (4.19%) |
43.92 |
43.37 - 46.66 |
0.8384 times |
Fri 31 October 2025 |
44.63 (-2.38%) |
45.36 |
40.05 - 46.37 |
1.1839 times |
Tue 30 September 2025 |
45.72 (-2.35%) |
46.39 |
43.99 - 47.46 |
1.036 times |
Fri 29 August 2025 |
46.82 (7.12%) |
42.92 |
41.98 - 47.14 |
0.9107 times |
Thu 31 July 2025 |
43.71 (1.67%) |
42.82 |
42.74 - 46.13 |
1.1208 times |
Mon 30 June 2025 |
42.99 (8.84%) |
39.21 |
38.68 - 43.24 |
0.8545 times |
Fri 30 May 2025 |
39.50 (3.03%) |
38.31 |
38.16 - 41.49 |
1.0047 times |
Wed 30 April 2025 |
38.34 (-6.83%) |
40.78 |
33.56 - 41.63 |
1.6985 times |
Mon 31 March 2025 |
41.15 (-11.22%) |
46.54 |
39.41 - 46.92 |
1.1846 times |
Fri 28 February 2025 |
46.35 (-2.67%) |
46.65 |
44.79 - 48.27 |
0.7579 times |
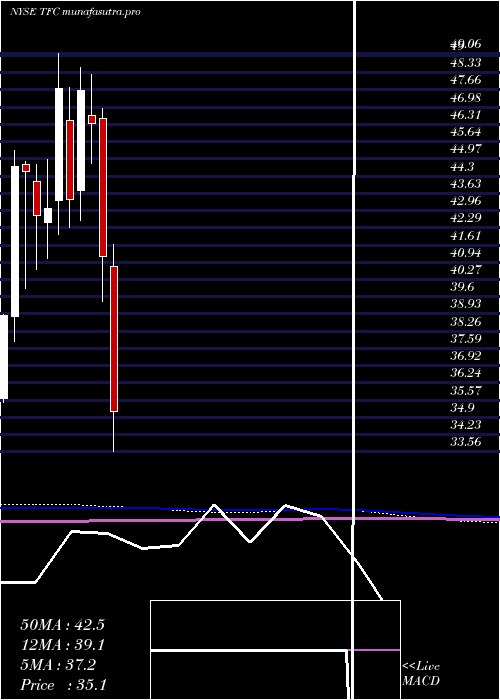
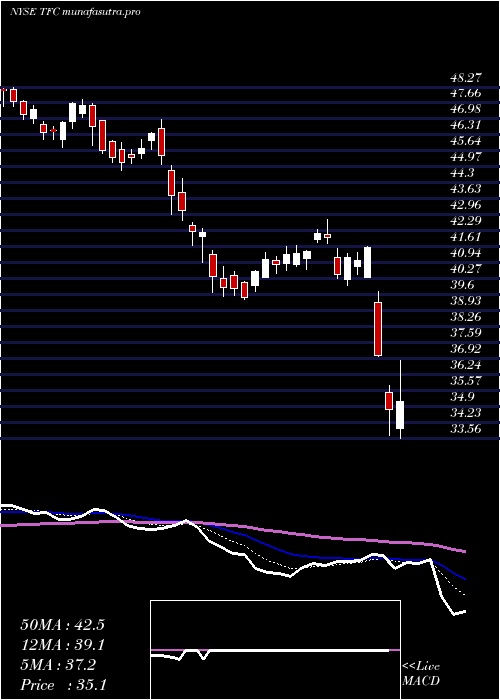
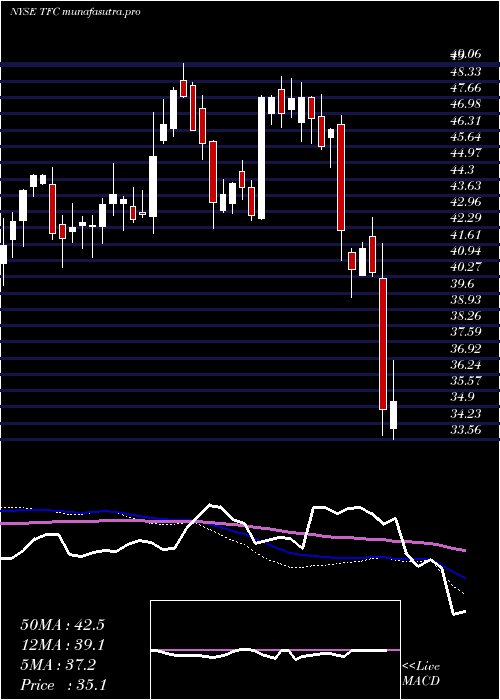
DMA SMA EMA moving averages of Truist Financial TFC
DMA (daily moving average) of Truist Financial TFC
| DMA period | DMA value | | 5 day DMA | 46.9 | | 12 day DMA | 45.95 | | 20 day DMA | 45.52 | | 35 day DMA | 44.77 | | 50 day DMA | 44.77 | | 100 day DMA | 44.92 | | 150 day DMA | 43.68 | | 200 day DMA | 42.68 | EMA (exponential moving average) of Truist Financial TFC
| EMA period | EMA current | EMA prev | EMA prev2 | | 5 day EMA | 46.95 | 46.66 | 46.28 | | 12 day EMA | 46.24 | 46 | 45.74 | | 20 day EMA | 45.77 | 45.58 | 45.39 | | 35 day EMA | 45.39 | 45.26 | 45.13 | | 50 day EMA | 45.07 | 44.97 | 44.87 |
SMA (simple moving average) of Truist Financial TFC
| SMA period | SMA current | SMA prev | SMA prev2 | | 5 day SMA | 46.9 | 46.64 | 46.42 | | 12 day SMA | 45.95 | 45.65 | 45.44 | | 20 day SMA | 45.52 | 45.34 | 45.16 | | 35 day SMA | 44.77 | 44.65 | 44.55 | | 50 day SMA | 44.77 | 44.73 | 44.7 | | 100 day SMA | 44.92 | 44.89 | 44.87 | | 150 day SMA | 43.68 | 43.62 | 43.56 | | 200 day SMA | 42.68 | 42.67 | 42.67 |
|
|
