TecoEnergy TE full analysis,charts,indicators,moving averages,SMA,DMA,EMA,ADX,MACD,RSITeco Energy TE WideScreen charts, DMA,SMA,EMA technical analysis, forecast prediction, by indicators ADX,MACD,RSI,CCI NYSE stock exchange
Daily price and charts and targets TecoEnergy Strong Daily Stock price targets for TecoEnergy TE are 5.14 and 6.58 | Daily Target 1 | 3.95 | | Daily Target 2 | 4.89 | | Daily Target 3 | 5.39 | | Daily Target 4 | 6.33 | | Daily Target 5 | 6.83 |
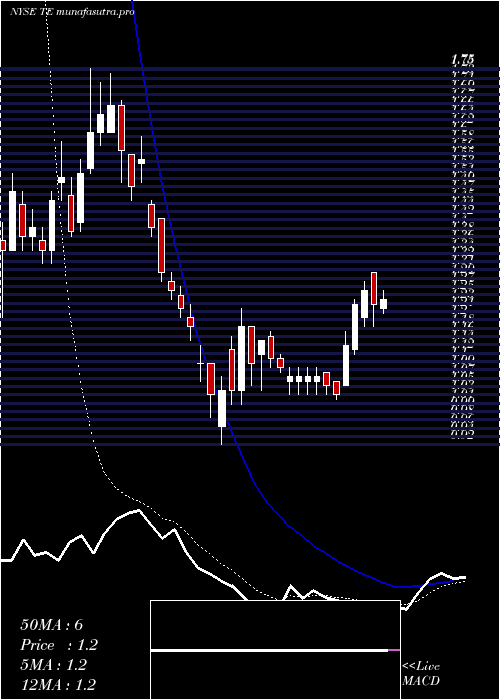
Daily price and volume Teco Energy
| Date |
Closing |
Open |
Range |
Volume |
Fri 05 December 2025 |
5.83 (14.09%) |
5.00 |
4.45 - 5.89 |
1.488 times |
Thu 04 December 2025 |
5.11 (13.05%) |
4.48 |
4.40 - 5.20 |
0.9352 times |
Wed 03 December 2025 |
4.52 (-4.84%) |
4.70 |
4.32 - 4.72 |
1.0385 times |
Tue 02 December 2025 |
4.75 (6.26%) |
4.50 |
4.45 - 5.01 |
1.0383 times |
Mon 01 December 2025 |
4.47 (8.5%) |
4.03 |
3.96 - 4.70 |
1.6691 times |
Fri 28 November 2025 |
4.12 (7.29%) |
3.84 |
3.79 - 4.23 |
0.6883 times |
Wed 26 November 2025 |
3.84 (16.72%) |
3.26 |
3.23 - 3.84 |
0.8007 times |
Tue 25 November 2025 |
3.29 (4.44%) |
3.19 |
2.97 - 3.32 |
0.4704 times |
Mon 24 November 2025 |
3.15 (15.81%) |
2.80 |
2.74 - 3.37 |
0.9578 times |
Fri 21 November 2025 |
2.72 (0%) |
2.73 |
2.52 - 2.79 |
0.9137 times |
Thu 20 November 2025 |
2.72 (-5.88%) |
2.98 |
2.72 - 3.20 |
0.8149 times |
Weekly price and charts TecoEnergy Strong weekly Stock price targets for TecoEnergy TE are 4.9 and 6.83 | Weekly Target 1 | 3.3 | | Weekly Target 2 | 4.56 | | Weekly Target 3 | 5.2266666666667 | | Weekly Target 4 | 6.49 | | Weekly Target 5 | 7.16 |
Weekly price and volumes for Teco Energy
| Date |
Closing |
Open |
Range |
Volume |
Fri 05 December 2025 |
5.83 (41.5%) |
4.03 |
3.96 - 5.89 |
1.5408 times |
Fri 28 November 2025 |
4.12 (51.47%) |
2.80 |
2.74 - 4.23 |
0.7286 times |
Fri 21 November 2025 |
2.72 (-19.05%) |
3.30 |
2.52 - 3.51 |
1.052 times |
Fri 14 November 2025 |
3.36 (-11.81%) |
4.10 |
2.80 - 4.63 |
1.5117 times |
Fri 07 November 2025 |
3.81 (2.42%) |
3.46 |
3.16 - 4.34 |
1.2451 times |
Fri 31 October 2025 |
3.72 (0%) |
3.68 |
3.41 - 4.10 |
0.2996 times |
Fri 31 October 2025 |
3.72 (7.2%) |
3.66 |
3.37 - 4.10 |
1.0558 times |
Fri 24 October 2025 |
3.47 (-19.68%) |
4.52 |
3.40 - 4.88 |
0.9712 times |
Fri 17 October 2025 |
4.32 (51.05%) |
3.85 |
3.20 - 5.31 |
1.4127 times |
Tue 07 October 2025 |
2.86 (13.04%) |
2.54 |
2.47 - 3.01 |
0.1826 times |
Fri 03 October 2025 |
2.53 (15%) |
2.22 |
2.07 - 2.54 |
0.3081 times |
Monthly price and charts TecoEnergy Strong monthly Stock price targets for TecoEnergy TE are 4.9 and 6.83 | Monthly Target 1 | 3.3 | | Monthly Target 2 | 4.56 | | Monthly Target 3 | 5.2266666666667 | | Monthly Target 4 | 6.49 | | Monthly Target 5 | 7.16 |
Monthly price and volumes Teco Energy
| Date |
Closing |
Open |
Range |
Volume |
Fri 05 December 2025 |
5.83 (41.5%) |
4.03 |
3.96 - 5.89 |
1.0072 times |
Fri 28 November 2025 |
4.12 (10.75%) |
3.46 |
2.52 - 4.63 |
2.9661 times |
Fri 31 October 2025 |
3.72 (70.64%) |
2.17 |
2.17 - 5.31 |
2.6723 times |
Tue 30 September 2025 |
2.18 (32.12%) |
1.59 |
1.59 - 2.46 |
0.7268 times |
Fri 29 August 2025 |
1.65 (38.66%) |
1.18 |
1.15 - 1.68 |
0.4832 times |
Thu 31 July 2025 |
1.19 (-3.25%) |
1.20 |
1.16 - 1.68 |
0.4198 times |
Mon 30 June 2025 |
1.23 (12.84%) |
1.10 |
1.03 - 1.48 |
0.5124 times |
Fri 30 May 2025 |
1.09 (-9.92%) |
1.25 |
0.93 - 1.61 |
0.4713 times |
Wed 30 April 2025 |
1.21 (-3.97%) |
1.25 |
0.92 - 1.30 |
0.3399 times |
Mon 31 March 2025 |
1.26 (-95.44%) |
1.55 |
1.20 - 1.75 |
0.401 times |
Thu 30 June 2016 |
27.64 (0%) |
27.63 |
27.60 - 27.70 |
0.4436 times |

DMA SMA EMA moving averages of Teco Energy TE
DMA (daily moving average) of Teco Energy TE
| DMA period | DMA value | | 5 day DMA | 4.94 | | 12 day DMA | 3.95 | | 20 day DMA | 3.85 | | 35 day DMA | 3.87 | | 50 day DMA | 3.58 | | 100 day DMA | 2.57 | | 150 day DMA | 2.14 | | 200 day DMA | | EMA (exponential moving average) of Teco Energy TE
| EMA period | EMA current | EMA prev | EMA prev2 | | 5 day EMA | 4.98 | 4.56 | 4.29 | | 12 day EMA | 4.36 | 4.09 | 3.9 | | 20 day EMA | 4.07 | 3.88 | 3.75 | | 35 day EMA | 3.75 | 3.63 | 3.54 | | 50 day EMA | 3.58 | 3.49 | 3.42 |
SMA (simple moving average) of Teco Energy TE
| SMA period | SMA current | SMA prev | SMA prev2 | | 5 day SMA | 4.94 | 4.59 | 4.34 | | 12 day SMA | 3.95 | 3.72 | 3.56 | | 20 day SMA | 3.85 | 3.75 | 3.69 | | 35 day SMA | 3.87 | 3.84 | 3.84 | | 50 day SMA | 3.58 | 3.5 | 3.44 | | 100 day SMA | 2.57 | 2.53 | 2.49 | | 150 day SMA | 2.14 | 2.11 | 2.08 | | 200 day SMA |
|
|
