TelephoneAnd TDS full analysis,charts,indicators,moving averages,SMA,DMA,EMA,ADX,MACD,RSITelephone And TDS WideScreen charts, DMA,SMA,EMA technical analysis, forecast prediction, by indicators ADX,MACD,RSI,CCI NYSE stock exchange
operates under Public Utilities sector & deals in Telecommunications Equipment
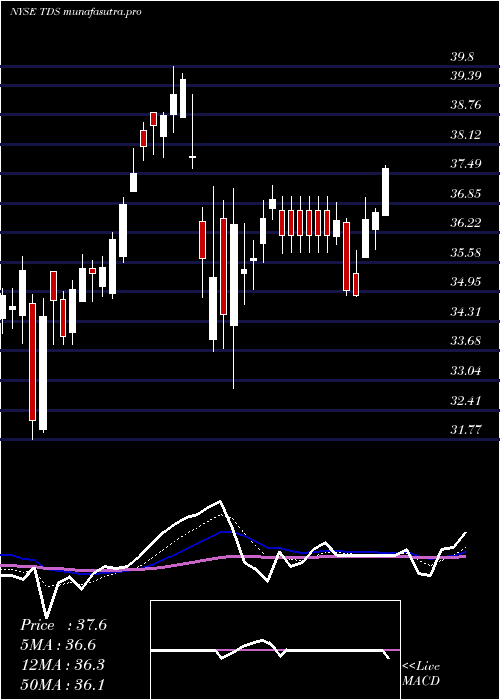
Daily price and charts and targets TelephoneAnd Strong Daily Stock price targets for TelephoneAnd TDS are 39.09 and 39.83 | Daily Target 1 | 38.49 | | Daily Target 2 | 38.95 | | Daily Target 3 | 39.233333333333 | | Daily Target 4 | 39.69 | | Daily Target 5 | 39.97 |
Daily price and volume Telephone And
| Date |
Closing |
Open |
Range |
Volume |
Fri 05 December 2025 |
39.40 (1.08%) |
38.98 |
38.78 - 39.52 |
0.9661 times |
Thu 04 December 2025 |
38.98 (-0.86%) |
39.31 |
38.70 - 39.68 |
0.7033 times |
Wed 03 December 2025 |
39.32 (-0.76%) |
39.64 |
39.32 - 39.84 |
0.7549 times |
Tue 02 December 2025 |
39.62 (0.25%) |
39.82 |
39.25 - 39.93 |
0.7607 times |
Mon 01 December 2025 |
39.52 (-1.86%) |
39.99 |
39.43 - 40.22 |
0.9486 times |
Fri 28 November 2025 |
40.27 (1.38%) |
39.32 |
39.32 - 40.28 |
0.4177 times |
Wed 26 November 2025 |
39.72 (1.27%) |
39.32 |
39.32 - 40.25 |
1.6676 times |
Tue 25 November 2025 |
39.22 (3.24%) |
38.33 |
37.60 - 39.26 |
1.3001 times |
Mon 24 November 2025 |
37.99 (-0.42%) |
38.30 |
37.83 - 38.44 |
1.4229 times |
Fri 21 November 2025 |
38.15 (1.33%) |
38.08 |
37.74 - 38.47 |
1.0581 times |
Thu 20 November 2025 |
37.65 (-0.95%) |
37.76 |
37.53 - 38.70 |
1.1473 times |
Weekly price and charts TelephoneAnd Strong weekly Stock price targets for TelephoneAnd TDS are 38.29 and 39.81 | Weekly Target 1 | 37.92 | | Weekly Target 2 | 38.66 | | Weekly Target 3 | 39.44 | | Weekly Target 4 | 40.18 | | Weekly Target 5 | 40.96 |
Weekly price and volumes for Telephone And
| Date |
Closing |
Open |
Range |
Volume |
Fri 05 December 2025 |
39.40 (-2.16%) |
39.99 |
38.70 - 40.22 |
1.0474 times |
Fri 28 November 2025 |
40.27 (5.56%) |
38.30 |
37.60 - 40.28 |
1.2183 times |
Fri 21 November 2025 |
38.15 (-0.44%) |
38.31 |
37.22 - 38.86 |
1.3028 times |
Fri 14 November 2025 |
38.32 (1.67%) |
38.08 |
37.26 - 40.02 |
1.4122 times |
Fri 07 November 2025 |
37.69 (-2.91%) |
39.20 |
35.86 - 39.83 |
1.225 times |
Fri 31 October 2025 |
38.82 (0%) |
38.45 |
38.11 - 39.07 |
0.2054 times |
Fri 31 October 2025 |
38.82 (-0.21%) |
39.28 |
38.11 - 39.86 |
0.8642 times |
Fri 24 October 2025 |
38.90 (1.07%) |
38.81 |
37.74 - 38.98 |
0.7678 times |
Fri 17 October 2025 |
38.49 (-1.71%) |
38.29 |
38.07 - 40.57 |
1.3299 times |
Tue 07 October 2025 |
39.16 (-0.94%) |
39.50 |
38.59 - 39.76 |
0.627 times |
Fri 03 October 2025 |
39.53 (5.39%) |
37.41 |
37.23 - 39.88 |
1.588 times |
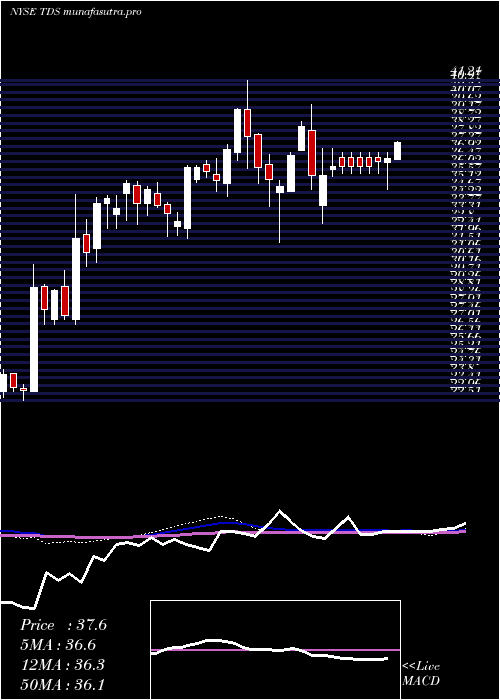
Monthly price and charts TelephoneAnd Strong monthly Stock price targets for TelephoneAnd TDS are 38.29 and 39.81 | Monthly Target 1 | 37.92 | | Monthly Target 2 | 38.66 | | Monthly Target 3 | 39.44 | | Monthly Target 4 | 40.18 | | Monthly Target 5 | 40.96 |
Monthly price and volumes Telephone And
| Date |
Closing |
Open |
Range |
Volume |
Fri 05 December 2025 |
39.40 (-2.16%) |
39.99 |
38.70 - 40.22 |
0.1714 times |
Fri 28 November 2025 |
40.27 (3.74%) |
39.20 |
35.86 - 40.28 |
0.8444 times |
Fri 31 October 2025 |
38.82 (-1.07%) |
38.89 |
37.74 - 40.57 |
0.7508 times |
Tue 30 September 2025 |
39.24 (-2.12%) |
39.56 |
36.81 - 41.17 |
1.1609 times |
Fri 29 August 2025 |
40.09 (2.69%) |
38.41 |
35.95 - 41.07 |
1.5134 times |
Thu 31 July 2025 |
39.04 (9.72%) |
35.55 |
34.94 - 42.74 |
1.5598 times |
Mon 30 June 2025 |
35.58 (3.55%) |
34.30 |
32.60 - 36.21 |
0.8713 times |
Fri 30 May 2025 |
34.36 (-8.35%) |
37.55 |
31.07 - 38.08 |
1.1217 times |
Wed 30 April 2025 |
37.49 (-3.23%) |
38.76 |
32.86 - 39.80 |
0.931 times |
Mon 31 March 2025 |
38.74 (7.31%) |
36.28 |
31.77 - 38.82 |
1.0753 times |
Fri 28 February 2025 |
36.10 (2.12%) |
35.17 |
34.46 - 41.21 |
0.8875 times |

DMA SMA EMA moving averages of Telephone And TDS
DMA (daily moving average) of Telephone And TDS
| DMA period | DMA value | | 5 day DMA | 39.37 | | 12 day DMA | 38.99 | | 20 day DMA | 38.79 | | 35 day DMA | 38.79 | | 50 day DMA | 38.72 | | 100 day DMA | 38.78 | | 150 day DMA | 37.49 | | 200 day DMA | 37.18 | EMA (exponential moving average) of Telephone And TDS
| EMA period | EMA current | EMA prev | EMA prev2 | | 5 day EMA | 39.31 | 39.27 | 39.42 | | 12 day EMA | 39.12 | 39.07 | 39.09 | | 20 day EMA | 38.97 | 38.93 | 38.93 | | 35 day EMA | 38.81 | 38.77 | 38.76 | | 50 day EMA | 38.73 | 38.7 | 38.69 |
SMA (simple moving average) of Telephone And TDS
| SMA period | SMA current | SMA prev | SMA prev2 | | 5 day SMA | 39.37 | 39.54 | 39.69 | | 12 day SMA | 38.99 | 38.88 | 38.77 | | 20 day SMA | 38.79 | 38.75 | 38.74 | | 35 day SMA | 38.79 | 38.77 | 38.76 | | 50 day SMA | 38.72 | 38.69 | 38.67 | | 100 day SMA | 38.78 | 38.78 | 38.78 | | 150 day SMA | 37.49 | 37.48 | 37.47 | | 200 day SMA | 37.18 | 37.18 | 37.19 |
|
|
