TempletonDragon TDF full analysis,charts,indicators,moving averages,SMA,DMA,EMA,ADX,MACD,RSITempleton Dragon TDF WideScreen charts, DMA,SMA,EMA technical analysis, forecast prediction, by indicators ADX,MACD,RSI,CCI NYSE stock exchange
operates under N A sector & deals in N A
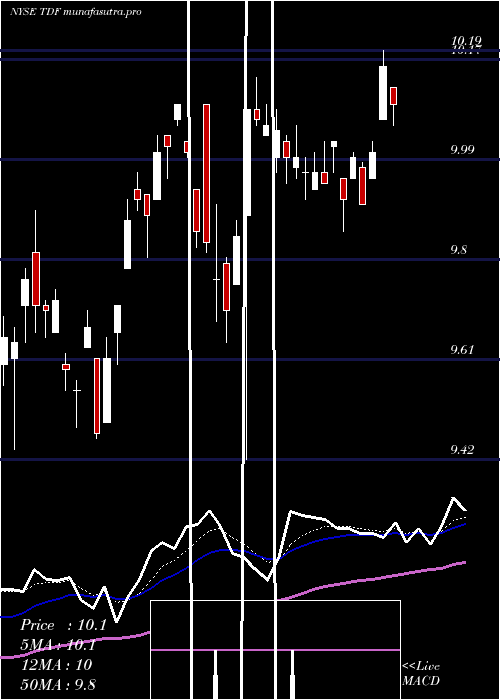
Daily price and charts and targets TempletonDragon Strong Daily Stock price targets for TempletonDragon TDF are 11.1 and 11.27 | Daily Target 1 | 11.04 | | Daily Target 2 | 11.15 | | Daily Target 3 | 11.213333333333 | | Daily Target 4 | 11.32 | | Daily Target 5 | 11.38 |
Daily price and volume Templeton Dragon
| Date |
Closing |
Open |
Range |
Volume |
Thu 04 December 2025 |
11.25 (0%) |
11.28 |
11.11 - 11.28 |
0.5726 times |
Wed 03 December 2025 |
11.25 (-0.18%) |
11.18 |
11.13 - 11.26 |
0.6142 times |
Tue 02 December 2025 |
11.27 (-0.18%) |
11.33 |
11.20 - 11.33 |
1.5553 times |
Mon 01 December 2025 |
11.29 (1.53%) |
11.16 |
11.11 - 11.40 |
1.0202 times |
Fri 28 November 2025 |
11.12 (0.54%) |
11.13 |
11.12 - 11.22 |
0.3602 times |
Wed 26 November 2025 |
11.06 (0.36%) |
11.07 |
11.00 - 11.14 |
1.1972 times |
Tue 25 November 2025 |
11.02 (0.46%) |
11.06 |
11.01 - 11.13 |
1.1514 times |
Mon 24 November 2025 |
10.97 (0.64%) |
10.94 |
10.94 - 11.03 |
1.3117 times |
Fri 21 November 2025 |
10.90 (-0.18%) |
10.82 |
10.34 - 10.98 |
0.9869 times |
Thu 20 November 2025 |
10.92 (-1.62%) |
11.20 |
10.92 - 11.28 |
1.2305 times |
Wed 19 November 2025 |
11.10 (-1.07%) |
11.10 |
11.08 - 11.17 |
0.5018 times |
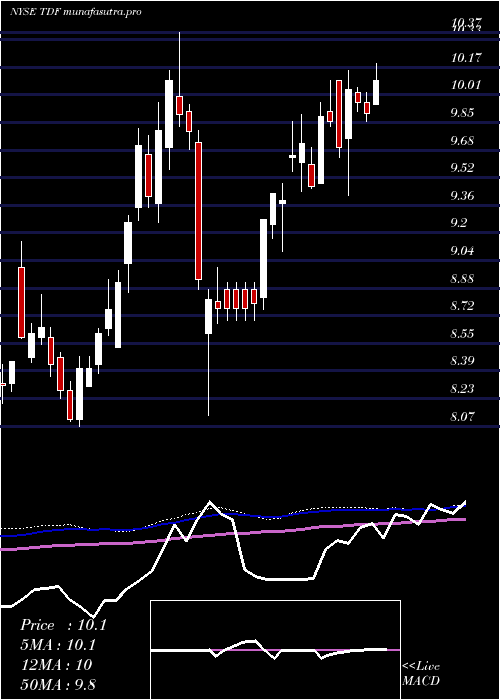
Weekly price and charts TempletonDragon Strong weekly Stock price targets for TempletonDragon TDF are 11.18 and 11.47 | Weekly Target 1 | 10.96 | | Weekly Target 2 | 11.11 | | Weekly Target 3 | 11.253333333333 | | Weekly Target 4 | 11.4 | | Weekly Target 5 | 11.54 |
Weekly price and volumes for Templeton Dragon
| Date |
Closing |
Open |
Range |
Volume |
Thu 04 December 2025 |
11.25 (1.17%) |
11.16 |
11.11 - 11.40 |
0.4942 times |
Fri 28 November 2025 |
11.12 (2.02%) |
10.94 |
10.94 - 11.22 |
0.5281 times |
Fri 21 November 2025 |
10.90 (-4.89%) |
11.32 |
10.34 - 11.35 |
0.8092 times |
Fri 14 November 2025 |
11.46 (-0.61%) |
11.63 |
11.34 - 11.86 |
1.392 times |
Fri 07 November 2025 |
11.53 (1.23%) |
11.33 |
10.95 - 11.80 |
1.5701 times |
Fri 31 October 2025 |
11.39 (0%) |
11.45 |
11.01 - 11.49 |
0.3733 times |
Fri 31 October 2025 |
11.39 (-1.13%) |
11.58 |
11.01 - 11.84 |
1.6447 times |
Fri 24 October 2025 |
11.52 (0.88%) |
11.35 |
11.25 - 11.70 |
0.5626 times |
Fri 17 October 2025 |
11.42 (2.33%) |
11.35 |
11.04 - 11.68 |
1.6898 times |
Fri 10 October 2025 |
11.16 (-5.74%) |
11.83 |
11.10 - 12.03 |
0.936 times |
Fri 03 October 2025 |
11.84 (3.5%) |
11.52 |
11.45 - 12.04 |
1.2379 times |
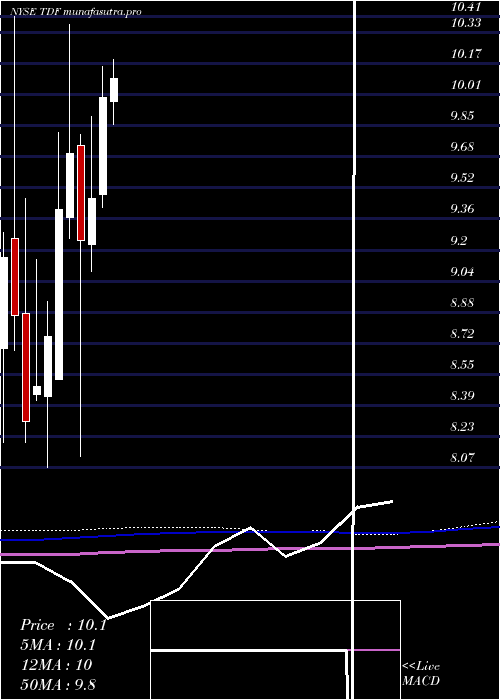
Monthly price and charts TempletonDragon Strong monthly Stock price targets for TempletonDragon TDF are 11.18 and 11.47 | Monthly Target 1 | 10.96 | | Monthly Target 2 | 11.11 | | Monthly Target 3 | 11.253333333333 | | Monthly Target 4 | 11.4 | | Monthly Target 5 | 11.54 |
Monthly price and volumes Templeton Dragon
| Date |
Closing |
Open |
Range |
Volume |
Thu 04 December 2025 |
11.25 (1.17%) |
11.16 |
11.11 - 11.40 |
0.1392 times |
Fri 28 November 2025 |
11.12 (-2.37%) |
11.33 |
10.34 - 11.86 |
1.2109 times |
Fri 31 October 2025 |
11.39 (-2.23%) |
11.68 |
11.01 - 12.04 |
1.635 times |
Tue 30 September 2025 |
11.65 (4.11%) |
11.20 |
11.10 - 11.95 |
1.6084 times |
Fri 29 August 2025 |
11.19 (9.49%) |
10.14 |
10.02 - 11.26 |
0.6394 times |
Thu 31 July 2025 |
10.22 (2.3%) |
9.97 |
9.85 - 10.50 |
0.4821 times |
Mon 30 June 2025 |
9.99 (5.49%) |
9.49 |
9.42 - 10.15 |
0.3892 times |
Fri 30 May 2025 |
9.47 (2.38%) |
9.23 |
9.09 - 9.89 |
1.2356 times |
Wed 30 April 2025 |
9.25 (-4.64%) |
9.74 |
8.13 - 9.80 |
0.9538 times |
Mon 31 March 2025 |
9.70 (3.08%) |
9.37 |
9.26 - 10.37 |
1.7064 times |
Fri 28 February 2025 |
9.41 (7.54%) |
8.53 |
8.53 - 9.81 |
1.9247 times |
DMA SMA EMA moving averages of Templeton Dragon TDF
DMA (daily moving average) of Templeton Dragon TDF
| DMA period | DMA value | | 5 day DMA | 11.24 | | 12 day DMA | 11.11 | | 20 day DMA | 11.29 | | 35 day DMA | 11.36 | | 50 day DMA | 11.44 | | 100 day DMA | 11.14 | | 150 day DMA | 10.69 | | 200 day DMA | 10.36 | EMA (exponential moving average) of Templeton Dragon TDF
| EMA period | EMA current | EMA prev | EMA prev2 | | 5 day EMA | 11.22 | 11.2 | 11.18 | | 12 day EMA | 11.21 | 11.2 | 11.19 | | 20 day EMA | 11.24 | 11.24 | 11.24 | | 35 day EMA | 11.33 | 11.34 | 11.35 | | 50 day EMA | 11.41 | 11.42 | 11.43 |
SMA (simple moving average) of Templeton Dragon TDF
| SMA period | SMA current | SMA prev | SMA prev2 | | 5 day SMA | 11.24 | 11.2 | 11.15 | | 12 day SMA | 11.11 | 11.11 | 11.13 | | 20 day SMA | 11.29 | 11.3 | 11.3 | | 35 day SMA | 11.36 | 11.37 | 11.37 | | 50 day SMA | 11.44 | 11.44 | 11.44 | | 100 day SMA | 11.14 | 11.13 | 11.12 | | 150 day SMA | 10.69 | 10.67 | 10.66 | | 200 day SMA | 10.36 | 10.35 | 10.34 |
|
|
