TranscontinentalRealty TCI full analysis,charts,indicators,moving averages,SMA,DMA,EMA,ADX,MACD,RSITranscontinental Realty TCI WideScreen charts, DMA,SMA,EMA technical analysis, forecast prediction, by indicators ADX,MACD,RSI,CCI NYSE stock exchange
operates under Consumer Services sector & deals in Real Estate Investment Trusts
Daily price and charts and targets TranscontinentalRealty Strong Daily Stock price targets for TranscontinentalRealty TCI are 43.44 and 44.3 | Daily Target 1 | 42.72 | | Daily Target 2 | 43.3 | | Daily Target 3 | 43.583333333333 | | Daily Target 4 | 44.16 | | Daily Target 5 | 44.44 |
Daily price and volume Transcontinental Realty
| Date |
Closing |
Open |
Range |
Volume |
Fri 05 December 2025 |
43.87 (-0.2%) |
43.01 |
43.01 - 43.87 |
0.3571 times |
Thu 04 December 2025 |
43.96 (-2.31%) |
43.96 |
43.96 - 43.96 |
0.4762 times |
Wed 03 December 2025 |
45.00 (2.23%) |
43.00 |
43.00 - 45.00 |
1.0714 times |
Tue 02 December 2025 |
44.02 (-1.21%) |
44.02 |
44.02 - 44.02 |
0.4762 times |
Mon 01 December 2025 |
44.56 (-3.09%) |
45.00 |
44.56 - 45.00 |
2.1429 times |
Fri 28 November 2025 |
45.98 (0.79%) |
45.98 |
45.98 - 45.98 |
0.3571 times |
Wed 26 November 2025 |
45.62 (-0.83%) |
46.00 |
44.30 - 46.00 |
1.0714 times |
Tue 25 November 2025 |
46.00 (0%) |
44.41 |
44.41 - 46.00 |
0.7143 times |
Mon 24 November 2025 |
46.00 (-4.17%) |
46.50 |
45.50 - 46.50 |
1.25 times |
Fri 21 November 2025 |
48.00 (5.75%) |
46.01 |
46.00 - 48.00 |
2.0833 times |
Thu 20 November 2025 |
45.39 (-0.09%) |
45.39 |
45.39 - 45.39 |
0.3571 times |
Weekly price and charts TranscontinentalRealty Strong weekly Stock price targets for TranscontinentalRealty TCI are 42.44 and 44.44 | Weekly Target 1 | 41.96 | | Weekly Target 2 | 42.91 | | Weekly Target 3 | 43.956666666667 | | Weekly Target 4 | 44.91 | | Weekly Target 5 | 45.96 |
Weekly price and volumes for Transcontinental Realty
| Date |
Closing |
Open |
Range |
Volume |
Fri 05 December 2025 |
43.87 (-4.59%) |
45.00 |
43.00 - 45.00 |
1.4477 times |
Fri 28 November 2025 |
45.98 (-4.21%) |
46.50 |
44.30 - 46.50 |
1.0858 times |
Fri 21 November 2025 |
48.00 (6.93%) |
46.00 |
43.95 - 48.00 |
1.5429 times |
Fri 14 November 2025 |
44.89 (-3.5%) |
46.00 |
43.00 - 46.50 |
0.8762 times |
Fri 07 November 2025 |
46.52 (3.79%) |
44.28 |
44.28 - 47.85 |
0.8572 times |
Fri 31 October 2025 |
44.82 (0%) |
43.53 |
43.53 - 45.00 |
0.2857 times |
Fri 31 October 2025 |
44.82 (-0.4%) |
45.50 |
43.00 - 45.97 |
1.4858 times |
Fri 24 October 2025 |
45.00 (0.09%) |
45.00 |
42.84 - 45.00 |
0.8191 times |
Fri 17 October 2025 |
44.96 (-0.07%) |
44.20 |
42.72 - 45.33 |
1.2001 times |
Tue 07 October 2025 |
44.99 (-1.51%) |
45.07 |
44.20 - 45.78 |
0.3995 times |
Fri 03 October 2025 |
45.68 (-3.81%) |
47.54 |
45.68 - 47.95 |
0.6431 times |

Monthly price and charts TranscontinentalRealty Strong monthly Stock price targets for TranscontinentalRealty TCI are 42.44 and 44.44 | Monthly Target 1 | 41.96 | | Monthly Target 2 | 42.91 | | Monthly Target 3 | 43.956666666667 | | Monthly Target 4 | 44.91 | | Monthly Target 5 | 45.96 |
Monthly price and volumes Transcontinental Realty
| Date |
Closing |
Open |
Range |
Volume |
Fri 05 December 2025 |
43.87 (-4.59%) |
45.00 |
43.00 - 45.00 |
0.159 times |
Fri 28 November 2025 |
45.98 (2.59%) |
44.28 |
43.00 - 48.00 |
0.4792 times |
Fri 31 October 2025 |
44.82 (-2.84%) |
47.95 |
42.72 - 47.95 |
0.5017 times |
Tue 30 September 2025 |
46.13 (-2.1%) |
46.00 |
44.20 - 47.54 |
0.8245 times |
Fri 29 August 2025 |
47.12 (14.93%) |
40.41 |
39.78 - 48.00 |
0.8182 times |
Thu 31 July 2025 |
41.00 (-3.78%) |
44.51 |
39.09 - 46.41 |
1.3727 times |
Mon 30 June 2025 |
42.61 (8.34%) |
38.00 |
35.46 - 46.74 |
2.4828 times |
Fri 30 May 2025 |
39.33 (36.75%) |
28.58 |
27.65 - 40.15 |
1.5972 times |
Wed 30 April 2025 |
28.76 (2.9%) |
28.48 |
26.96 - 29.99 |
1.106 times |
Mon 31 March 2025 |
27.95 (-2.95%) |
29.12 |
27.76 - 30.40 |
0.6585 times |
Fri 28 February 2025 |
28.80 (11.46%) |
25.50 |
25.50 - 29.98 |
1.1761 times |

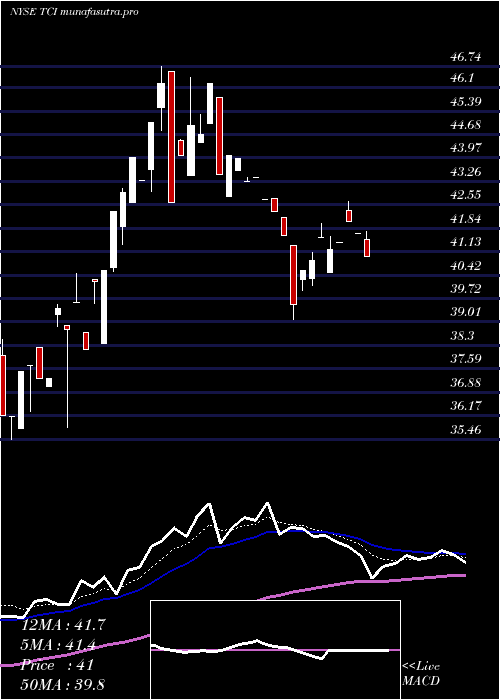
DMA SMA EMA moving averages of Transcontinental Realty TCI
DMA (daily moving average) of Transcontinental Realty TCI
| DMA period | DMA value | | 5 day DMA | 44.28 | | 12 day DMA | 45.32 | | 20 day DMA | 45.39 | | 35 day DMA | 45.16 | | 50 day DMA | 45.29 | | 100 day DMA | 44.88 | | 150 day DMA | 42.49 | | 200 day DMA | 38.95 | EMA (exponential moving average) of Transcontinental Realty TCI
| EMA period | EMA current | EMA prev | EMA prev2 | | 5 day EMA | 44.4 | 44.66 | 45.01 | | 12 day EMA | 44.94 | 45.13 | 45.34 | | 20 day EMA | 45.15 | 45.28 | 45.42 | | 35 day EMA | 45.27 | 45.35 | 45.43 | | 50 day EMA | 45.25 | 45.31 | 45.37 |
SMA (simple moving average) of Transcontinental Realty TCI
| SMA period | SMA current | SMA prev | SMA prev2 | | 5 day SMA | 44.28 | 44.7 | 45.04 | | 12 day SMA | 45.32 | 45.5 | 45.63 | | 20 day SMA | 45.39 | 45.53 | 45.73 | | 35 day SMA | 45.16 | 45.14 | 45.11 | | 50 day SMA | 45.29 | 45.35 | 45.4 | | 100 day SMA | 44.88 | 44.88 | 44.88 | | 150 day SMA | 42.49 | 42.38 | 42.27 | | 200 day SMA | 38.95 | 38.86 | 38.78 |
|
|
