MolsonCoors TAP full analysis,charts,indicators,moving averages,SMA,DMA,EMA,ADX,MACD,RSIMolson Coors TAP WideScreen charts, DMA,SMA,EMA technical analysis, forecast prediction, by indicators ADX,MACD,RSI,CCI NYSE stock exchange
operates under Consumer Non Durables sector & deals in Beverages Production Distribution
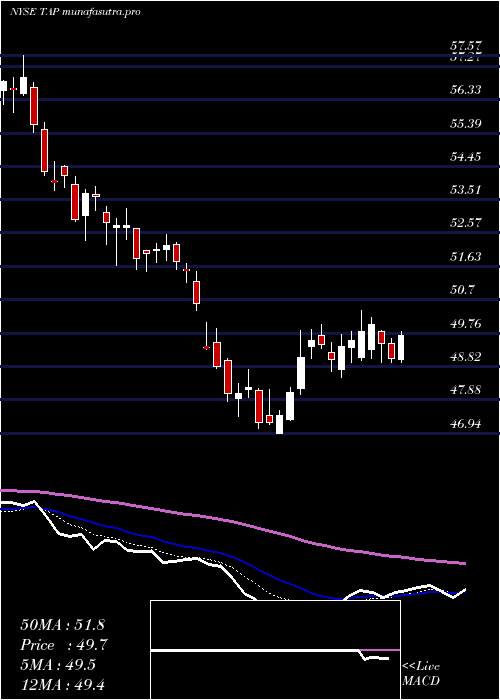
Daily price and charts and targets MolsonCoors Strong Daily Stock price targets for MolsonCoors TAP are 46.2 and 46.98 | Daily Target 1 | 46.07 | | Daily Target 2 | 46.33 | | Daily Target 3 | 46.846666666667 | | Daily Target 4 | 47.11 | | Daily Target 5 | 47.63 |
Daily price and volume Molson Coors
| Date |
Closing |
Open |
Range |
Volume |
Mon 20 October 2025 |
46.60 (-1.54%) |
47.34 |
46.58 - 47.36 |
0.7703 times |
Fri 17 October 2025 |
47.33 (0.62%) |
47.19 |
46.70 - 47.52 |
0.8955 times |
Thu 16 October 2025 |
47.04 (1.44%) |
46.55 |
46.41 - 47.19 |
0.8799 times |
Wed 15 October 2025 |
46.37 (-0.77%) |
46.59 |
45.56 - 47.05 |
1.2736 times |
Tue 14 October 2025 |
46.73 (1.52%) |
45.99 |
45.81 - 46.82 |
1.0255 times |
Mon 13 October 2025 |
46.03 (0.13%) |
45.80 |
45.67 - 46.39 |
0.9856 times |
Fri 10 October 2025 |
45.97 (-0.09%) |
46.32 |
45.70 - 46.58 |
1.0371 times |
Thu 09 October 2025 |
46.01 (0.9%) |
45.72 |
45.34 - 46.10 |
1.1208 times |
Wed 08 October 2025 |
45.60 (-1.26%) |
46.18 |
45.57 - 46.29 |
0.9736 times |
Tue 07 October 2025 |
46.18 (1.16%) |
46.00 |
45.72 - 46.47 |
1.0383 times |
Mon 06 October 2025 |
45.65 (-1.6%) |
46.49 |
45.64 - 46.49 |
0.7948 times |
Weekly price and charts MolsonCoors Strong weekly Stock price targets for MolsonCoors TAP are 46.2 and 46.98 | Weekly Target 1 | 46.07 | | Weekly Target 2 | 46.33 | | Weekly Target 3 | 46.846666666667 | | Weekly Target 4 | 47.11 | | Weekly Target 5 | 47.63 |
Weekly price and volumes for Molson Coors
| Date |
Closing |
Open |
Range |
Volume |
Mon 20 October 2025 |
46.60 (-1.54%) |
47.34 |
46.58 - 47.36 |
0.1663 times |
Fri 17 October 2025 |
47.33 (2.96%) |
45.80 |
45.56 - 47.52 |
1.0927 times |
Fri 10 October 2025 |
45.97 (-0.91%) |
46.49 |
45.34 - 46.58 |
1.0721 times |
Fri 03 October 2025 |
46.39 (3.48%) |
44.89 |
44.55 - 46.70 |
1.2013 times |
Fri 26 September 2025 |
44.83 (-3.74%) |
46.10 |
43.80 - 46.31 |
1.6841 times |
Fri 19 September 2025 |
46.57 (-3.82%) |
48.46 |
46.35 - 48.60 |
1.5641 times |
Fri 12 September 2025 |
48.42 (-3.91%) |
50.09 |
48.06 - 50.31 |
1.1441 times |
Fri 05 September 2025 |
50.39 (-0.2%) |
49.55 |
49.42 - 50.66 |
0.8767 times |
Fri 29 August 2025 |
50.49 (0%) |
50.40 |
50.14 - 50.94 |
0.1771 times |
Fri 29 August 2025 |
50.49 (-4.39%) |
52.58 |
49.79 - 52.81 |
1.0215 times |
Fri 22 August 2025 |
52.81 (2.7%) |
51.31 |
50.61 - 52.94 |
1.0818 times |
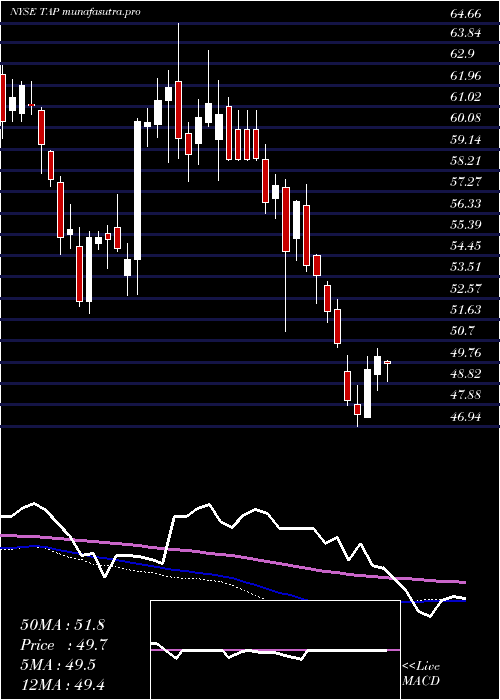
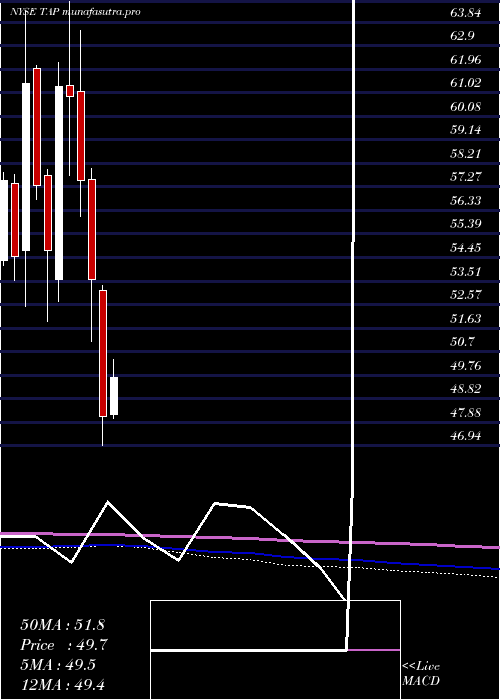
Monthly price and charts MolsonCoors Strong monthly Stock price targets for MolsonCoors TAP are 45.97 and 48.15 | Monthly Target 1 | 44.31 | | Monthly Target 2 | 45.45 | | Monthly Target 3 | 46.486666666667 | | Monthly Target 4 | 47.63 | | Monthly Target 5 | 48.67 |
Monthly price and volumes Molson Coors
| Date |
Closing |
Open |
Range |
Volume |
Mon 20 October 2025 |
46.60 (2.98%) |
45.88 |
45.34 - 47.52 |
0.5994 times |
Tue 30 September 2025 |
45.25 (-10.38%) |
49.55 |
43.80 - 50.66 |
1.171 times |
Fri 29 August 2025 |
50.49 (3.63%) |
49.31 |
47.95 - 52.94 |
1.0907 times |
Thu 31 July 2025 |
48.72 (1.31%) |
48.19 |
48.02 - 52.15 |
1.0422 times |
Mon 30 June 2025 |
48.09 (-10.26%) |
53.15 |
46.94 - 53.33 |
1.0385 times |
Fri 30 May 2025 |
53.59 (-6.85%) |
57.55 |
51.10 - 58.01 |
1.3166 times |
Wed 30 April 2025 |
57.53 (-5.49%) |
61.08 |
56.07 - 63.50 |
0.95 times |
Mon 31 March 2025 |
60.87 (-0.69%) |
61.30 |
57.72 - 64.66 |
1.0068 times |
Fri 28 February 2025 |
61.29 (11.95%) |
53.59 |
52.69 - 62.24 |
1.0113 times |
Fri 31 January 2025 |
54.75 (-4.48%) |
57.73 |
51.91 - 57.96 |
0.7735 times |
Tue 31 December 2024 |
57.32 (-6.66%) |
61.99 |
56.76 - 62.13 |
0.543 times |
DMA SMA EMA moving averages of Molson Coors TAP
DMA (daily moving average) of Molson Coors TAP
| DMA period | DMA value | | 5 day DMA | 46.81 | | 12 day DMA | 46.33 | | 20 day DMA | 45.89 | | 35 day DMA | 46.99 | | 50 day DMA | 48.26 | | 100 day DMA | 49.23 | | 150 day DMA | 52.19 | | 200 day DMA | 53.41 | EMA (exponential moving average) of Molson Coors TAP
| EMA period | EMA current | EMA prev | EMA prev2 | | 5 day EMA | 46.73 | 46.8 | 46.53 | | 12 day EMA | 46.46 | 46.44 | 46.28 | | 20 day EMA | 46.55 | 46.54 | 46.46 | | 35 day EMA | 47.29 | 47.33 | 47.33 | | 50 day EMA | 48.27 | 48.34 | 48.38 |
SMA (simple moving average) of Molson Coors TAP
| SMA period | SMA current | SMA prev | SMA prev2 | | 5 day SMA | 46.81 | 46.7 | 46.43 | | 12 day SMA | 46.33 | 46.29 | 46.18 | | 20 day SMA | 45.89 | 45.81 | 45.77 | | 35 day SMA | 46.99 | 47.1 | 47.19 | | 50 day SMA | 48.26 | 48.33 | 48.4 | | 100 day SMA | 49.23 | 49.31 | 49.37 | | 150 day SMA | 52.19 | 52.27 | 52.35 | | 200 day SMA | 53.41 | 53.46 | 53.51 |
|
|
