TakedaPharmaceutical TAK full analysis,charts,indicators,moving averages,SMA,DMA,EMA,ADX,MACD,RSITakeda Pharmaceutical TAK WideScreen charts, DMA,SMA,EMA technical analysis, forecast prediction, by indicators ADX,MACD,RSI,CCI NYSE stock exchange
operates under Health Care sector & deals in Major Pharmaceuticals
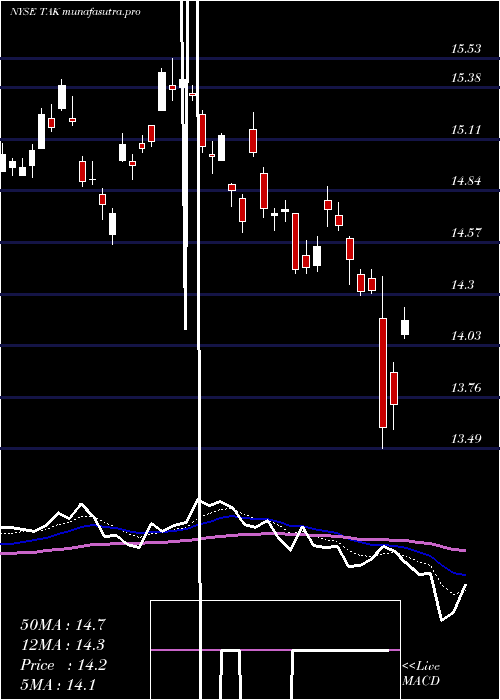
Daily price and charts and targets TakedaPharmaceutical Strong Daily Stock price targets for TakedaPharmaceutical TAK are 14.09 and 14.26 | Daily Target 1 | 14.05 | | Daily Target 2 | 14.12 | | Daily Target 3 | 14.223333333333 | | Daily Target 4 | 14.29 | | Daily Target 5 | 14.39 |
Daily price and volume Takeda Pharmaceutical
| Date |
Closing |
Open |
Range |
Volume |
Fri 05 December 2025 |
14.18 (-0.7%) |
14.23 |
14.16 - 14.33 |
0.701 times |
Thu 04 December 2025 |
14.28 (-0.21%) |
14.39 |
14.26 - 14.42 |
0.6987 times |
Wed 03 December 2025 |
14.31 (0.14%) |
14.32 |
14.28 - 14.40 |
0.7949 times |
Tue 02 December 2025 |
14.29 (-1.18%) |
14.42 |
14.29 - 14.42 |
0.9439 times |
Mon 01 December 2025 |
14.46 (0.28%) |
14.48 |
14.46 - 14.54 |
1.142 times |
Fri 28 November 2025 |
14.42 (-0.69%) |
14.38 |
14.38 - 14.44 |
0.7858 times |
Wed 26 November 2025 |
14.52 (0.14%) |
14.51 |
14.49 - 14.54 |
0.8003 times |
Tue 25 November 2025 |
14.50 (1.97%) |
14.30 |
14.30 - 14.56 |
1.5729 times |
Mon 24 November 2025 |
14.22 (-0.56%) |
14.27 |
14.22 - 14.30 |
1.0367 times |
Fri 21 November 2025 |
14.30 (1.71%) |
14.10 |
14.09 - 14.35 |
1.5238 times |
Thu 20 November 2025 |
14.06 (-0.21%) |
14.10 |
14.01 - 14.16 |
1.3122 times |
Weekly price and charts TakedaPharmaceutical Strong weekly Stock price targets for TakedaPharmaceutical TAK are 13.98 and 14.36 | Weekly Target 1 | 13.91 | | Weekly Target 2 | 14.05 | | Weekly Target 3 | 14.293333333333 | | Weekly Target 4 | 14.43 | | Weekly Target 5 | 14.67 |
Weekly price and volumes for Takeda Pharmaceutical
| Date |
Closing |
Open |
Range |
Volume |
Fri 05 December 2025 |
14.18 (-1.66%) |
14.48 |
14.16 - 14.54 |
0.8897 times |
Fri 28 November 2025 |
14.42 (0.84%) |
14.27 |
14.22 - 14.56 |
0.8721 times |
Fri 21 November 2025 |
14.30 (0.07%) |
14.13 |
13.89 - 14.35 |
1.2553 times |
Fri 14 November 2025 |
14.29 (4.61%) |
13.62 |
13.56 - 14.41 |
1.4459 times |
Fri 07 November 2025 |
13.66 (1.64%) |
13.55 |
13.50 - 13.68 |
0.948 times |
Fri 31 October 2025 |
13.44 (0%) |
13.42 |
13.36 - 13.50 |
0.2278 times |
Fri 31 October 2025 |
13.44 (-4.07%) |
14.17 |
12.99 - 14.23 |
1.3561 times |
Fri 24 October 2025 |
14.01 (-0.21%) |
14.01 |
13.99 - 14.14 |
0.7421 times |
Fri 17 October 2025 |
14.04 (2.41%) |
13.74 |
13.71 - 14.05 |
1.1956 times |
Fri 10 October 2025 |
13.71 (-6.1%) |
14.56 |
13.67 - 14.72 |
1.0673 times |
Fri 03 October 2025 |
14.60 (-0.95%) |
14.65 |
14.30 - 14.78 |
1.1615 times |

Monthly price and charts TakedaPharmaceutical Strong monthly Stock price targets for TakedaPharmaceutical TAK are 13.98 and 14.36 | Monthly Target 1 | 13.91 | | Monthly Target 2 | 14.05 | | Monthly Target 3 | 14.293333333333 | | Monthly Target 4 | 14.43 | | Monthly Target 5 | 14.67 |
Monthly price and volumes Takeda Pharmaceutical
| Date |
Closing |
Open |
Range |
Volume |
Fri 05 December 2025 |
14.18 (-1.66%) |
14.48 |
14.16 - 14.54 |
0.2133 times |
Fri 28 November 2025 |
14.42 (7.29%) |
13.55 |
13.50 - 14.56 |
1.0837 times |
Fri 31 October 2025 |
13.44 (-8.2%) |
14.52 |
12.99 - 14.78 |
1.2908 times |
Tue 30 September 2025 |
14.64 (-2.33%) |
15.12 |
14.41 - 15.69 |
1.1088 times |
Fri 29 August 2025 |
14.99 (9.26%) |
14.09 |
14.07 - 15.56 |
1.2796 times |
Thu 31 July 2025 |
13.72 (-11.25%) |
15.39 |
13.49 - 15.53 |
1.883 times |
Mon 30 June 2025 |
15.46 (2.86%) |
14.98 |
14.56 - 15.48 |
0.7254 times |
Fri 30 May 2025 |
15.03 (-1.7%) |
15.20 |
13.55 - 15.43 |
0.8632 times |
Wed 30 April 2025 |
15.29 (2.82%) |
15.00 |
13.60 - 15.37 |
0.9582 times |
Mon 31 March 2025 |
14.87 (3.19%) |
14.57 |
14.55 - 15.31 |
0.594 times |
Fri 28 February 2025 |
14.41 (7.62%) |
13.25 |
13.19 - 14.42 |
0.5327 times |

DMA SMA EMA moving averages of Takeda Pharmaceutical TAK
DMA (daily moving average) of Takeda Pharmaceutical TAK
| DMA period | DMA value | | 5 day DMA | 14.3 | | 12 day DMA | 14.3 | | 20 day DMA | 14.19 | | 35 day DMA | 14.04 | | 50 day DMA | 14.11 | | 100 day DMA | 14.47 | | 150 day DMA | 14.59 | | 200 day DMA | 14.64 | EMA (exponential moving average) of Takeda Pharmaceutical TAK
| EMA period | EMA current | EMA prev | EMA prev2 | | 5 day EMA | 14.28 | 14.33 | 14.35 | | 12 day EMA | 14.26 | 14.28 | 14.28 | | 20 day EMA | 14.23 | 14.23 | 14.22 | | 35 day EMA | 14.22 | 14.22 | 14.22 | | 50 day EMA | 14.19 | 14.19 | 14.19 |
SMA (simple moving average) of Takeda Pharmaceutical TAK
| SMA period | SMA current | SMA prev | SMA prev2 | | 5 day SMA | 14.3 | 14.35 | 14.4 | | 12 day SMA | 14.3 | 14.29 | 14.28 | | 20 day SMA | 14.19 | 14.17 | 14.13 | | 35 day SMA | 14.04 | 14.03 | 14.01 | | 50 day SMA | 14.11 | 14.12 | 14.13 | | 100 day SMA | 14.47 | 14.48 | 14.48 | | 150 day SMA | 14.59 | 14.6 | 14.6 | | 200 day SMA | 14.64 | 14.64 | 14.64 |
|
|
