AtT T-C full analysis,charts,indicators,moving averages,SMA,DMA,EMA,ADX,MACD,RSIAt T T-C WideScreen charts, DMA,SMA,EMA technical analysis, forecast prediction, by indicators ADX,MACD,RSI,CCI NYSE stock exchange
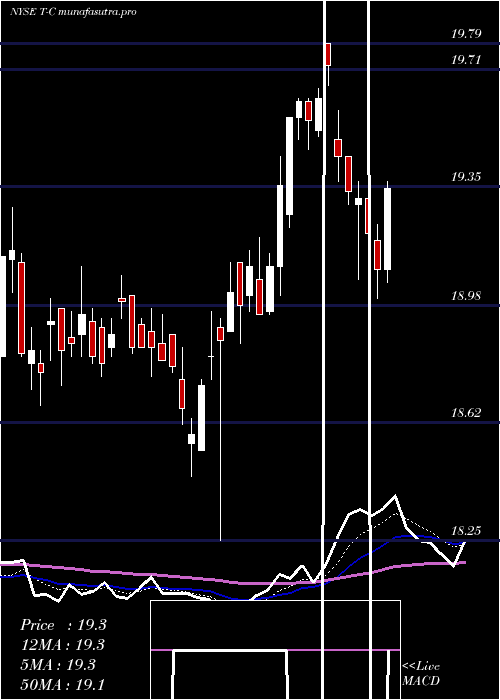
Daily price and charts and targets AtT Strong Daily Stock price targets for AtT T-C are 18.7 and 18.83 | Daily Target 1 | 18.67 | | Daily Target 2 | 18.73 | | Daily Target 3 | 18.8 | | Daily Target 4 | 18.86 | | Daily Target 5 | 18.93 |
Daily price and volume At T
| Date |
Closing |
Open |
Range |
Volume |
Thu 04 December 2025 |
18.79 (-0.37%) |
18.82 |
18.74 - 18.87 |
0.6111 times |
Wed 03 December 2025 |
18.86 (0.37%) |
18.80 |
18.74 - 18.90 |
0.6368 times |
Tue 02 December 2025 |
18.79 (-0.63%) |
18.89 |
18.72 - 18.94 |
3.9779 times |
Mon 01 December 2025 |
18.91 (-0.32%) |
18.86 |
18.82 - 18.97 |
0.5616 times |
Fri 28 November 2025 |
18.97 (-0.68%) |
19.11 |
18.93 - 19.16 |
0.7583 times |
Wed 26 November 2025 |
19.10 (0.47%) |
19.09 |
19.02 - 19.15 |
0.462 times |
Tue 25 November 2025 |
19.01 (0.37%) |
18.93 |
18.83 - 19.03 |
0.415 times |
Mon 24 November 2025 |
18.94 (0.42%) |
18.92 |
18.86 - 18.98 |
0.4061 times |
Fri 21 November 2025 |
18.86 (0.69%) |
18.73 |
18.73 - 18.95 |
0.5305 times |
Thu 20 November 2025 |
18.73 (-0.95%) |
18.96 |
18.70 - 19.02 |
1.6407 times |
Wed 19 November 2025 |
18.91 (0.11%) |
18.85 |
18.75 - 19.00 |
1.7365 times |
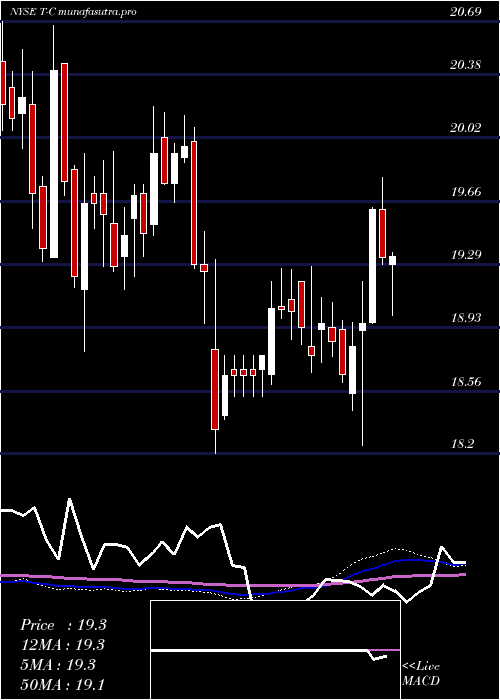
Weekly price and charts AtT Strong weekly Stock price targets for AtT T-C are 18.63 and 18.88 | Weekly Target 1 | 18.58 | | Weekly Target 2 | 18.68 | | Weekly Target 3 | 18.826666666667 | | Weekly Target 4 | 18.93 | | Weekly Target 5 | 19.08 |
Weekly price and volumes for At T
| Date |
Closing |
Open |
Range |
Volume |
Thu 04 December 2025 |
18.79 (-0.95%) |
18.86 |
18.72 - 18.97 |
1.8502 times |
Fri 28 November 2025 |
18.97 (0.58%) |
18.92 |
18.83 - 19.16 |
0.6526 times |
Fri 21 November 2025 |
18.86 (-1.82%) |
19.22 |
18.70 - 19.28 |
1.7808 times |
Fri 14 November 2025 |
19.21 (-1.08%) |
19.48 |
19.20 - 19.66 |
0.768 times |
Fri 07 November 2025 |
19.42 (-0.66%) |
19.42 |
19.26 - 19.52 |
0.416 times |
Fri 31 October 2025 |
19.55 (0%) |
19.66 |
19.44 - 19.66 |
0.2434 times |
Fri 31 October 2025 |
19.55 (-1.96%) |
20.02 |
19.44 - 20.02 |
2.1293 times |
Fri 24 October 2025 |
19.94 (0.81%) |
19.83 |
19.81 - 20.15 |
0.8567 times |
Fri 17 October 2025 |
19.78 (1.54%) |
19.59 |
19.42 - 19.84 |
0.5992 times |
Fri 10 October 2025 |
19.48 (-3.13%) |
20.15 |
19.36 - 20.21 |
0.7038 times |
Fri 03 October 2025 |
20.11 (0.55%) |
20.06 |
19.83 - 20.21 |
0.5257 times |
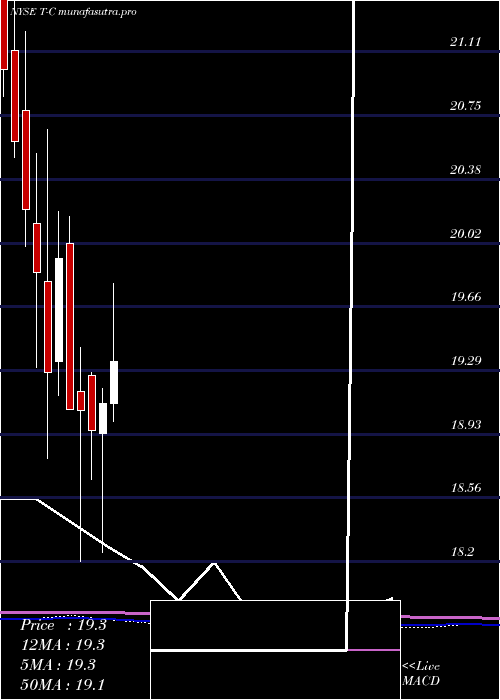
Monthly price and charts AtT Strong monthly Stock price targets for AtT T-C are 18.63 and 18.88 | Monthly Target 1 | 18.58 | | Monthly Target 2 | 18.68 | | Monthly Target 3 | 18.826666666667 | | Monthly Target 4 | 18.93 | | Monthly Target 5 | 19.08 |
Monthly price and volumes At T
| Date |
Closing |
Open |
Range |
Volume |
Thu 04 December 2025 |
18.79 (-0.95%) |
18.86 |
18.72 - 18.97 |
0.5827 times |
Fri 28 November 2025 |
18.97 (-2.97%) |
19.42 |
18.70 - 19.66 |
1.1392 times |
Fri 31 October 2025 |
19.55 (-1.86%) |
19.95 |
19.36 - 20.21 |
1.4717 times |
Tue 30 September 2025 |
19.92 (1.53%) |
19.51 |
19.51 - 20.62 |
0.9456 times |
Fri 29 August 2025 |
19.62 (0.62%) |
19.54 |
19.38 - 20.09 |
1.0697 times |
Thu 31 July 2025 |
19.50 (2.09%) |
19.10 |
19.00 - 19.79 |
0.8339 times |
Mon 30 June 2025 |
19.10 (0.79%) |
18.93 |
18.25 - 19.19 |
0.9812 times |
Fri 30 May 2025 |
18.95 (-0.58%) |
19.26 |
18.67 - 19.28 |
0.9806 times |
Wed 30 April 2025 |
19.06 (-0.05%) |
19.17 |
18.20 - 19.42 |
1.0858 times |
Mon 31 March 2025 |
19.07 (-4.32%) |
20.02 |
19.07 - 20.17 |
0.9096 times |
Fri 28 February 2025 |
19.93 (3.37%) |
19.34 |
19.15 - 20.20 |
0.8416 times |
DMA SMA EMA moving averages of At T T-C
DMA (daily moving average) of At T T-C
| DMA period | DMA value | | 5 day DMA | 18.86 | | 12 day DMA | 18.9 | | 20 day DMA | 19.08 | | 35 day DMA | 19.37 | | 50 day DMA | 19.54 | | 100 day DMA | 19.64 | | 150 day DMA | 19.43 | | 200 day DMA | 19.41 | EMA (exponential moving average) of At T T-C
| EMA period | EMA current | EMA prev | EMA prev2 | | 5 day EMA | 18.86 | 18.89 | 18.9 | | 12 day EMA | 18.96 | 18.99 | 19.01 | | 20 day EMA | 19.08 | 19.11 | 19.14 | | 35 day EMA | 19.29 | 19.32 | 19.35 | | 50 day EMA | 19.53 | 19.56 | 19.59 |
SMA (simple moving average) of At T T-C
| SMA period | SMA current | SMA prev | SMA prev2 | | 5 day SMA | 18.86 | 18.93 | 18.96 | | 12 day SMA | 18.9 | 18.91 | 18.94 | | 20 day SMA | 19.08 | 19.11 | 19.14 | | 35 day SMA | 19.37 | 19.4 | 19.42 | | 50 day SMA | 19.54 | 19.57 | 19.6 | | 100 day SMA | 19.64 | 19.64 | 19.65 | | 150 day SMA | 19.43 | 19.43 | 19.44 | | 200 day SMA | 19.41 | 19.42 | 19.42 |
|
|
