StandexInternational SXI full analysis,charts,indicators,moving averages,SMA,DMA,EMA,ADX,MACD,RSIStandex International SXI WideScreen charts, DMA,SMA,EMA technical analysis, forecast prediction, by indicators ADX,MACD,RSI,CCI NYSE stock exchange
operates under Technology sector & deals in Industrial Machinery Components
Daily price and charts and targets StandexInternational Strong Daily Stock price targets for StandexInternational SXI are 241.34 and 252.1 | Daily Target 1 | 233.33 | | Daily Target 2 | 238.58 | | Daily Target 3 | 244.09333333333 | | Daily Target 4 | 249.34 | | Daily Target 5 | 254.85 |
Daily price and volume Standex International
| Date |
Closing |
Open |
Range |
Volume |
Thu 04 December 2025 |
243.82 (1.16%) |
239.92 |
238.85 - 249.61 |
0.8817 times |
Wed 03 December 2025 |
241.03 (0.15%) |
242.02 |
237.57 - 242.85 |
1.2243 times |
Tue 02 December 2025 |
240.68 (-0.53%) |
243.06 |
239.55 - 244.80 |
0.9741 times |
Mon 01 December 2025 |
241.96 (-1.31%) |
243.42 |
239.96 - 246.61 |
1.5985 times |
Fri 28 November 2025 |
245.16 (0.77%) |
245.88 |
241.81 - 245.88 |
0.2693 times |
Wed 26 November 2025 |
243.29 (0.4%) |
240.83 |
239.29 - 245.88 |
1.5734 times |
Tue 25 November 2025 |
242.31 (3.02%) |
237.44 |
235.99 - 245.34 |
0.7603 times |
Mon 24 November 2025 |
235.20 (2.57%) |
229.29 |
225.89 - 235.79 |
0.7299 times |
Fri 21 November 2025 |
229.31 (3.21%) |
224.18 |
223.88 - 231.27 |
1.087 times |
Thu 20 November 2025 |
222.18 (-2.12%) |
230.86 |
219.62 - 234.53 |
0.9015 times |
Wed 19 November 2025 |
227.00 (0.36%) |
225.58 |
225.50 - 230.27 |
0.9999 times |
Weekly price and charts StandexInternational Strong weekly Stock price targets for StandexInternational SXI are 240.7 and 252.74 | Weekly Target 1 | 231.63 | | Weekly Target 2 | 237.72 | | Weekly Target 3 | 243.66666666667 | | Weekly Target 4 | 249.76 | | Weekly Target 5 | 255.71 |
Weekly price and volumes for Standex International
| Date |
Closing |
Open |
Range |
Volume |
Thu 04 December 2025 |
243.82 (-0.55%) |
243.42 |
237.57 - 249.61 |
1.2573 times |
Fri 28 November 2025 |
245.16 (6.91%) |
229.29 |
225.89 - 245.88 |
0.8956 times |
Fri 21 November 2025 |
229.31 (-1.68%) |
233.30 |
219.62 - 236.76 |
1.1819 times |
Fri 14 November 2025 |
233.24 (-1.66%) |
238.96 |
215.62 - 242.74 |
1.0107 times |
Fri 07 November 2025 |
237.17 (1.69%) |
234.85 |
225.09 - 237.68 |
0.8935 times |
Fri 31 October 2025 |
233.23 (0%) |
235.40 |
216.33 - 237.00 |
0.4874 times |
Fri 31 October 2025 |
233.23 (-4.75%) |
244.79 |
216.33 - 247.16 |
1.2507 times |
Fri 24 October 2025 |
244.87 (4.92%) |
235.00 |
232.36 - 246.12 |
1.2612 times |
Fri 17 October 2025 |
233.39 (9.41%) |
220.99 |
220.00 - 236.06 |
1.4343 times |
Tue 07 October 2025 |
213.31 (-0.14%) |
215.26 |
209.85 - 218.07 |
0.3275 times |
Fri 03 October 2025 |
213.61 (4.84%) |
204.41 |
202.62 - 218.62 |
0.9546 times |
Monthly price and charts StandexInternational Strong monthly Stock price targets for StandexInternational SXI are 240.7 and 252.74 | Monthly Target 1 | 231.63 | | Monthly Target 2 | 237.72 | | Monthly Target 3 | 243.66666666667 | | Monthly Target 4 | 249.76 | | Monthly Target 5 | 255.71 |
Monthly price and volumes Standex International
| Date |
Closing |
Open |
Range |
Volume |
Thu 04 December 2025 |
243.82 (-0.55%) |
243.42 |
237.57 - 249.61 |
0.3508 times |
Fri 28 November 2025 |
245.16 (5.12%) |
234.85 |
215.62 - 245.88 |
1.1109 times |
Fri 31 October 2025 |
233.23 (10.07%) |
209.53 |
208.12 - 247.16 |
1.4899 times |
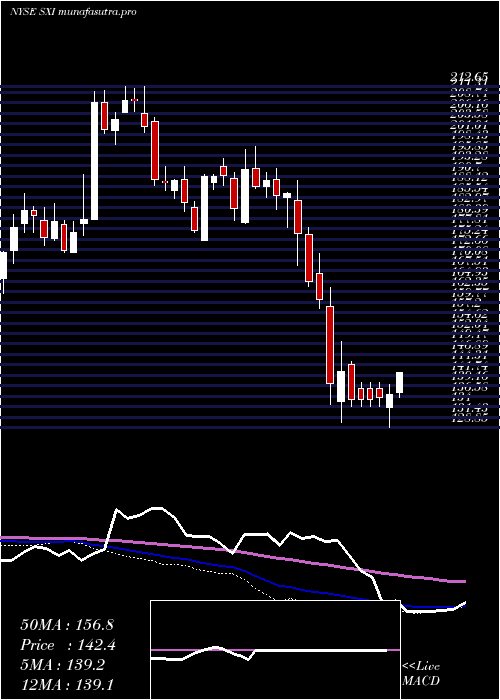
Tue 30 September 2025 |
211.90 (3.84%) |
201.16 |
197.00 - 215.77 |
0.9833 times |
Fri 29 August 2025 |
204.07 (23.87%) |
169.00 |
165.83 - 212.42 |
1.361 times |
Thu 31 July 2025 |
164.74 (5.28%) |
156.08 |
152.64 - 169.98 |
1.2237 times |
Mon 30 June 2025 |
156.48 (3.67%) |
151.33 |
147.75 - 160.80 |
1.1403 times |
Fri 30 May 2025 |
150.94 (6.73%) |
141.60 |
139.26 - 163.14 |
0.8618 times |
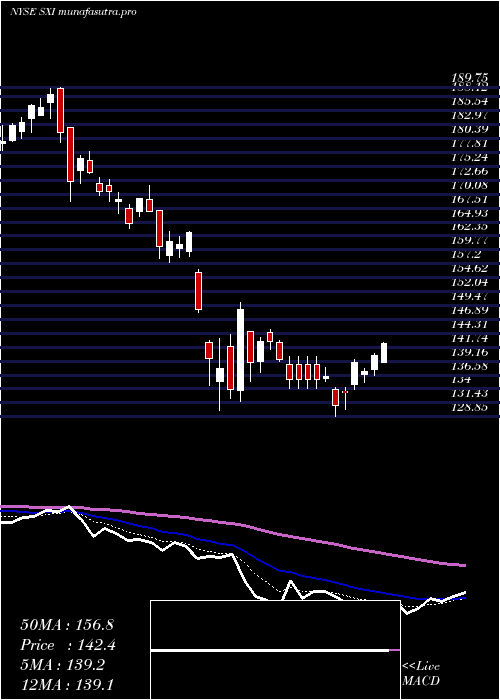
Wed 30 April 2025 |
141.42 (-12.37%) |
159.96 |
128.85 - 163.10 |
0.7761 times |
Mon 31 March 2025 |
161.39 (-13.22%) |
185.46 |
157.40 - 189.75 |
0.7021 times |
Fri 28 February 2025 |
185.98 (1.8%) |
179.39 |
179.05 - 198.00 |
0.5644 times |

DMA SMA EMA moving averages of Standex International SXI
DMA (daily moving average) of Standex International SXI
| DMA period | DMA value | | 5 day DMA | 242.53 | | 12 day DMA | 236.51 | | 20 day DMA | 235.7 | | 35 day DMA | 236.41 | | 50 day DMA | 229.43 | | 100 day DMA | 209.82 | | 150 day DMA | 191.57 | | 200 day DMA | 184.72 | EMA (exponential moving average) of Standex International SXI
| EMA period | EMA current | EMA prev | EMA prev2 | | 5 day EMA | 241.78 | 240.76 | 240.62 | | 12 day EMA | 238.94 | 238.05 | 237.51 | | 20 day EMA | 236.84 | 236.11 | 235.59 | | 35 day EMA | 232.38 | 231.71 | 231.16 | | 50 day EMA | 229.02 | 228.42 | 227.91 |
SMA (simple moving average) of Standex International SXI
| SMA period | SMA current | SMA prev | SMA prev2 | | 5 day SMA | 242.53 | 242.42 | 242.68 | | 12 day SMA | 236.51 | 235.47 | 234.82 | | 20 day SMA | 235.7 | 235.19 | 234.59 | | 35 day SMA | 236.41 | 236.13 | 235.81 | | 50 day SMA | 229.43 | 228.68 | 228.15 | | 100 day SMA | 209.82 | 209.05 | 208.31 | | 150 day SMA | 191.57 | 190.86 | 190.18 | | 200 day SMA | 184.72 | 184.45 | 184.22 |
|
|
