StanleyBlack SWK full analysis,charts,indicators,moving averages,SMA,DMA,EMA,ADX,MACD,RSIStanley Black SWK WideScreen charts, DMA,SMA,EMA technical analysis, forecast prediction, by indicators ADX,MACD,RSI,CCI NYSE stock exchange
operates under Capital Goods sector & deals in Industrial Machinery Components
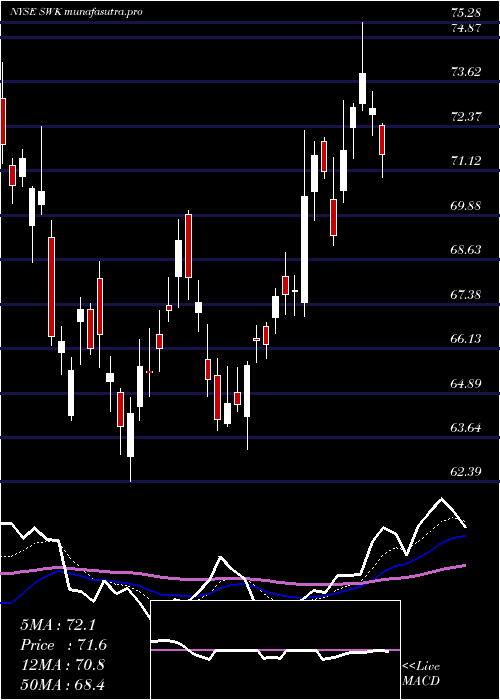
Daily price and charts and targets StanleyBlack Strong Daily Stock price targets for StanleyBlack SWK are 72.18 and 73.64 | Daily Target 1 | 71.11 | | Daily Target 2 | 71.79 | | Daily Target 3 | 72.57 | | Daily Target 4 | 73.25 | | Daily Target 5 | 74.03 |
Daily price and volume Stanley Black
| Date |
Closing |
Open |
Range |
Volume |
Fri 05 December 2025 |
72.47 (0.36%) |
72.12 |
71.89 - 73.35 |
1.014 times |
Thu 04 December 2025 |
72.21 (-0.44%) |
72.58 |
71.10 - 73.01 |
0.7794 times |
Wed 03 December 2025 |
72.53 (1.81%) |
71.42 |
71.06 - 72.81 |
1.1063 times |
Tue 02 December 2025 |
71.24 (0.96%) |
71.01 |
69.80 - 71.65 |
0.7967 times |
Mon 01 December 2025 |
70.56 (-1.34%) |
69.74 |
69.27 - 72.20 |
0.8524 times |
Fri 28 November 2025 |
71.52 (-0.43%) |
71.83 |
71.21 - 71.92 |
0.482 times |
Wed 26 November 2025 |
71.83 (1.56%) |
69.93 |
69.58 - 72.20 |
1.0675 times |
Tue 25 November 2025 |
70.73 (5.27%) |
68.23 |
68.22 - 71.10 |
1.2647 times |
Mon 24 November 2025 |
67.19 (1.57%) |
66.15 |
65.50 - 67.85 |
1.1518 times |
Fri 21 November 2025 |
66.15 (5.94%) |
62.99 |
62.70 - 66.92 |
1.4852 times |
Thu 20 November 2025 |
62.44 (0.52%) |
63.20 |
62.28 - 64.41 |
1.053 times |
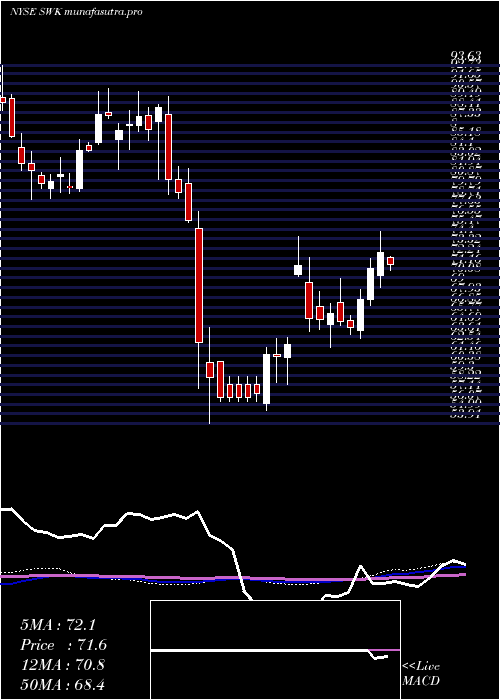
Weekly price and charts StanleyBlack Strong weekly Stock price targets for StanleyBlack SWK are 70.87 and 74.95 | Weekly Target 1 | 67.62 | | Weekly Target 2 | 70.04 | | Weekly Target 3 | 71.696666666667 | | Weekly Target 4 | 74.12 | | Weekly Target 5 | 75.78 |
Weekly price and volumes for Stanley Black
| Date |
Closing |
Open |
Range |
Volume |
Fri 05 December 2025 |
72.47 (1.33%) |
69.74 |
69.27 - 73.35 |
1.0245 times |
Fri 28 November 2025 |
71.52 (8.12%) |
66.15 |
65.50 - 72.20 |
0.8932 times |
Fri 21 November 2025 |
66.15 (0.76%) |
65.46 |
61.90 - 66.92 |
1.1794 times |
Fri 14 November 2025 |
65.65 (-3.84%) |
68.61 |
65.59 - 69.21 |
0.7417 times |
Fri 07 November 2025 |
68.27 (0.81%) |
65.77 |
65.24 - 71.80 |
1.4992 times |
Fri 31 October 2025 |
67.72 (0%) |
68.31 |
66.89 - 68.79 |
0.479 times |
Fri 31 October 2025 |
67.72 (-3.55%) |
71.13 |
66.89 - 73.43 |
1.5837 times |
Fri 24 October 2025 |
70.21 (3.48%) |
68.25 |
67.68 - 71.73 |
0.9657 times |
Fri 17 October 2025 |
67.85 (-7.3%) |
65.53 |
63.20 - 68.80 |
1.3342 times |
Tue 07 October 2025 |
73.19 (-2.96%) |
75.44 |
73.05 - 75.97 |
0.2993 times |
Fri 03 October 2025 |
75.42 (2.13%) |
74.52 |
72.55 - 75.98 |
0.9524 times |
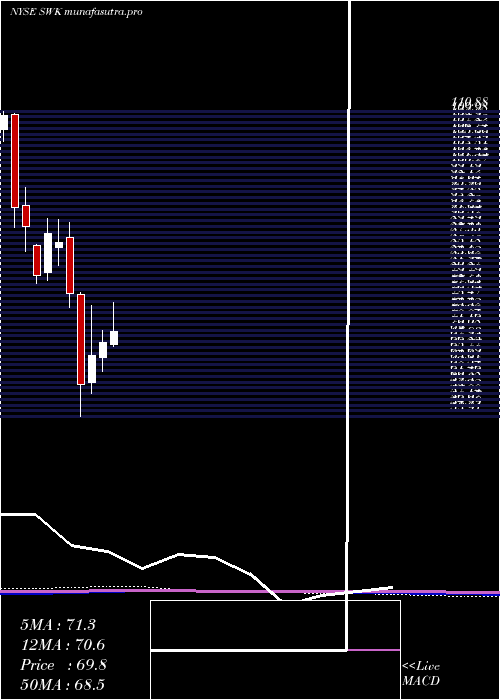
Monthly price and charts StanleyBlack Strong monthly Stock price targets for StanleyBlack SWK are 70.87 and 74.95 | Monthly Target 1 | 67.62 | | Monthly Target 2 | 70.04 | | Monthly Target 3 | 71.696666666667 | | Monthly Target 4 | 74.12 | | Monthly Target 5 | 75.78 |
Monthly price and volumes Stanley Black
| Date |
Closing |
Open |
Range |
Volume |
Fri 05 December 2025 |
72.47 (1.33%) |
69.74 |
69.27 - 73.35 |
0.167 times |
Fri 28 November 2025 |
71.52 (5.61%) |
65.77 |
61.90 - 72.20 |
0.7033 times |
Fri 31 October 2025 |
67.72 (-8.89%) |
73.90 |
63.20 - 75.98 |
0.8607 times |
Tue 30 September 2025 |
74.33 (0.05%) |
72.08 |
71.28 - 81.44 |
1.0114 times |
Fri 29 August 2025 |
74.29 (9.82%) |
66.73 |
65.41 - 77.94 |
0.9355 times |
Thu 31 July 2025 |
67.65 (-0.15%) |
67.44 |
66.51 - 75.28 |
1.1688 times |
Mon 30 June 2025 |
67.75 (3.55%) |
64.90 |
62.39 - 70.00 |
0.953 times |
Fri 30 May 2025 |
65.43 (9.01%) |
60.32 |
58.23 - 74.67 |
1.6075 times |
Wed 30 April 2025 |
60.02 (-21.93%) |
76.80 |
53.91 - 77.14 |
1.7834 times |
Mon 31 March 2025 |
76.88 (-11.15%) |
87.38 |
74.31 - 90.25 |
0.8093 times |
Fri 28 February 2025 |
86.53 (-1.75%) |
85.46 |
82.09 - 90.75 |
0.8485 times |
DMA SMA EMA moving averages of Stanley Black SWK
DMA (daily moving average) of Stanley Black SWK
| DMA period | DMA value | | 5 day DMA | 71.8 | | 12 day DMA | 69.25 | | 20 day DMA | 68.13 | | 35 day DMA | 68.63 | | 50 day DMA | 69.71 | | 100 day DMA | 71.65 | | 150 day DMA | 70.03 | | 200 day DMA | 70.92 | EMA (exponential moving average) of Stanley Black SWK
| EMA period | EMA current | EMA prev | EMA prev2 | | 5 day EMA | 71.8 | 71.46 | 71.09 | | 12 day EMA | 70.23 | 69.82 | 69.39 | | 20 day EMA | 69.53 | 69.22 | 68.9 | | 35 day EMA | 69.77 | 69.61 | 69.46 | | 50 day EMA | 70.56 | 70.48 | 70.41 |
SMA (simple moving average) of Stanley Black SWK
| SMA period | SMA current | SMA prev | SMA prev2 | | 5 day SMA | 71.8 | 71.61 | 71.54 | | 12 day SMA | 69.25 | 68.45 | 67.73 | | 20 day SMA | 68.13 | 67.88 | 67.75 | | 35 day SMA | 68.63 | 68.5 | 68.37 | | 50 day SMA | 69.71 | 69.76 | 69.85 | | 100 day SMA | 71.65 | 71.65 | 71.67 | | 150 day SMA | 70.03 | 69.96 | 69.89 | | 200 day SMA | 70.92 | 70.99 | 71.06 |
|
|
