SunocoLp SUN full analysis,charts,indicators,moving averages,SMA,DMA,EMA,ADX,MACD,RSISunoco Lp SUN WideScreen charts, DMA,SMA,EMA technical analysis, forecast prediction, by indicators ADX,MACD,RSI,CCI NYSE stock exchange
operates under Energy sector & deals in Oil Refining Marketing
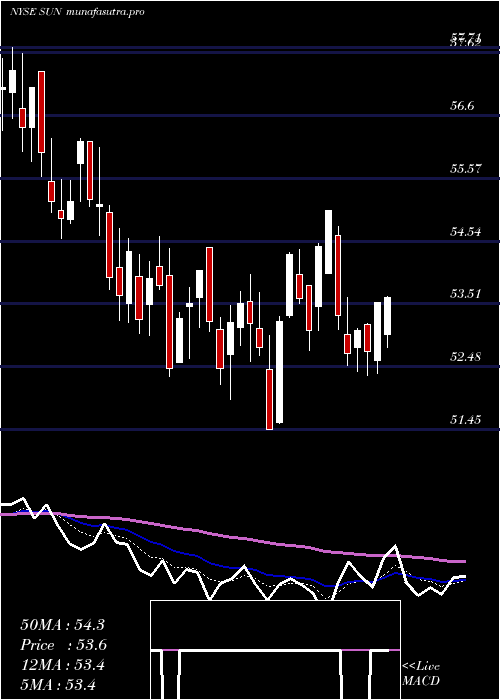
Daily price and charts and targets SunocoLp Strong Daily Stock price targets for SunocoLp SUN are 53.7 and 54.89 | Daily Target 1 | 53.45 | | Daily Target 2 | 53.94 | | Daily Target 3 | 54.64 | | Daily Target 4 | 55.13 | | Daily Target 5 | 55.83 |
Daily price and volume Sunoco Lp
| Date |
Closing |
Open |
Range |
Volume |
Fri 05 December 2025 |
54.43 (-0.31%) |
54.55 |
54.15 - 55.34 |
1.0581 times |
Thu 04 December 2025 |
54.60 (-0.55%) |
54.90 |
54.50 - 54.98 |
0.6258 times |
Wed 03 December 2025 |
54.90 (1.09%) |
54.20 |
54.20 - 55.06 |
0.6835 times |
Tue 02 December 2025 |
54.31 (-2.53%) |
55.73 |
54.31 - 55.73 |
1.1818 times |
Mon 01 December 2025 |
55.72 (-0.91%) |
55.74 |
55.51 - 56.35 |
0.8259 times |
Fri 28 November 2025 |
56.23 (0.5%) |
55.95 |
55.42 - 56.40 |
0.4268 times |
Wed 26 November 2025 |
55.95 (0.81%) |
55.50 |
55.12 - 56.15 |
1.3979 times |
Tue 25 November 2025 |
55.50 (0.4%) |
55.26 |
54.62 - 55.65 |
1.179 times |
Mon 24 November 2025 |
55.28 (-0.4%) |
55.10 |
54.55 - 55.66 |
1.0435 times |
Fri 21 November 2025 |
55.50 (1.65%) |
54.55 |
53.93 - 55.65 |
1.5777 times |
Thu 20 November 2025 |
54.60 (0.17%) |
54.49 |
54.00 - 55.48 |
2.0226 times |
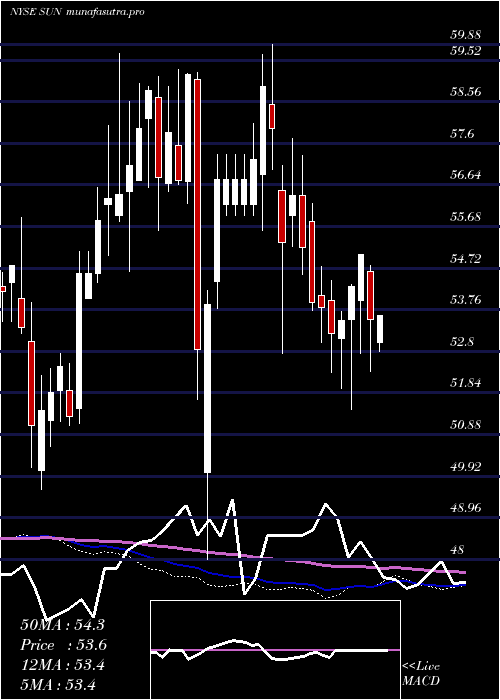
Weekly price and charts SunocoLp Strong weekly Stock price targets for SunocoLp SUN are 53.19 and 55.39 | Weekly Target 1 | 52.78 | | Weekly Target 2 | 53.6 | | Weekly Target 3 | 54.976666666667 | | Weekly Target 4 | 55.8 | | Weekly Target 5 | 57.18 |
Weekly price and volumes for Sunoco Lp
| Date |
Closing |
Open |
Range |
Volume |
Fri 05 December 2025 |
54.43 (-3.2%) |
55.74 |
54.15 - 56.35 |
0.5912 times |
Fri 28 November 2025 |
56.23 (1.32%) |
55.10 |
54.55 - 56.40 |
0.5469 times |
Fri 21 November 2025 |
55.50 (5.71%) |
52.78 |
52.54 - 55.65 |
1.3674 times |
Fri 14 November 2025 |
52.50 (3.35%) |
50.68 |
49.98 - 53.08 |
1.8065 times |
Fri 07 November 2025 |
50.80 (-2.72%) |
51.16 |
50.46 - 53.50 |
1.4954 times |
Fri 31 October 2025 |
52.22 (0%) |
53.02 |
52.00 - 53.46 |
0.2048 times |
Fri 31 October 2025 |
52.22 (-2.77%) |
53.97 |
50.62 - 54.97 |
0.9177 times |
Fri 24 October 2025 |
53.71 (-0.61%) |
53.68 |
53.24 - 54.77 |
0.6512 times |
Fri 17 October 2025 |
54.04 (9.33%) |
49.01 |
49.01 - 54.18 |
1.3424 times |
Fri 10 October 2025 |
49.43 (-1.18%) |
50.16 |
48.60 - 50.87 |
1.0765 times |
Fri 03 October 2025 |
50.02 (-0.99%) |
50.12 |
49.03 - 50.85 |
0.7837 times |
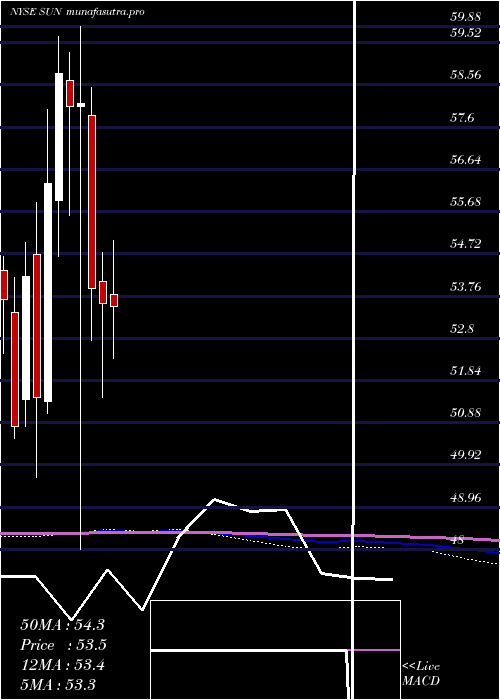
Monthly price and charts SunocoLp Strong monthly Stock price targets for SunocoLp SUN are 53.19 and 55.39 | Monthly Target 1 | 52.78 | | Monthly Target 2 | 53.6 | | Monthly Target 3 | 54.976666666667 | | Monthly Target 4 | 55.8 | | Monthly Target 5 | 57.18 |
Monthly price and volumes Sunoco Lp
| Date |
Closing |
Open |
Range |
Volume |
Fri 05 December 2025 |
54.43 (-3.2%) |
55.74 |
54.15 - 56.35 |
0.1953 times |
Fri 28 November 2025 |
56.23 (7.68%) |
51.16 |
49.98 - 56.40 |
1.7226 times |
Fri 31 October 2025 |
52.22 (4.42%) |
49.54 |
48.60 - 54.97 |
1.5228 times |
Tue 30 September 2025 |
50.01 (-4.38%) |
51.87 |
47.98 - 52.20 |
0.9749 times |
Fri 29 August 2025 |
52.30 (-5.44%) |
55.13 |
50.45 - 55.30 |
0.9746 times |
Thu 31 July 2025 |
55.31 (3.21%) |
53.80 |
51.56 - 55.63 |
0.8511 times |
Mon 30 June 2025 |
53.59 (-0.65%) |
54.10 |
51.45 - 54.75 |
0.9771 times |
Fri 30 May 2025 |
53.94 (-7.24%) |
57.87 |
52.75 - 58.50 |
1.107 times |
Wed 30 April 2025 |
58.15 (0.16%) |
58.06 |
48.00 - 59.88 |
0.8484 times |
Mon 31 March 2025 |
58.06 (-1.28%) |
58.67 |
55.60 - 59.30 |
0.8263 times |
Fri 28 February 2025 |
58.81 (4.4%) |
55.94 |
54.65 - 59.67 |
1.0588 times |
DMA SMA EMA moving averages of Sunoco Lp SUN
DMA (daily moving average) of Sunoco Lp SUN
| DMA period | DMA value | | 5 day DMA | 54.79 | | 12 day DMA | 55.13 | | 20 day DMA | 53.81 | | 35 day DMA | 53.59 | | 50 day DMA | 52.65 | | 100 day DMA | 52.23 | | 150 day DMA | 52.93 | | 200 day DMA | 53.97 | EMA (exponential moving average) of Sunoco Lp SUN
| EMA period | EMA current | EMA prev | EMA prev2 | | 5 day EMA | 54.76 | 54.93 | 55.1 | | 12 day EMA | 54.65 | 54.69 | 54.71 | | 20 day EMA | 54.21 | 54.19 | 54.15 | | 35 day EMA | 53.39 | 53.33 | 53.25 | | 50 day EMA | 52.58 | 52.5 | 52.41 |
SMA (simple moving average) of Sunoco Lp SUN
| SMA period | SMA current | SMA prev | SMA prev2 | | 5 day SMA | 54.79 | 55.15 | 55.42 | | 12 day SMA | 55.13 | 55.13 | 55.02 | | 20 day SMA | 53.81 | 53.7 | 53.6 | | 35 day SMA | 53.59 | 53.55 | 53.49 | | 50 day SMA | 52.65 | 52.56 | 52.46 | | 100 day SMA | 52.23 | 52.2 | 52.19 | | 150 day SMA | 52.93 | 52.95 | 52.97 | | 200 day SMA | 53.97 | 53.99 | 54.01 |
|
|
