SuncorEnergy SU full analysis,charts,indicators,moving averages,SMA,DMA,EMA,ADX,MACD,RSISuncor Energy SU WideScreen charts, DMA,SMA,EMA technical analysis, forecast prediction, by indicators ADX,MACD,RSI,CCI NYSE stock exchange
operates under Energy sector & deals in Integrated Oil Companies
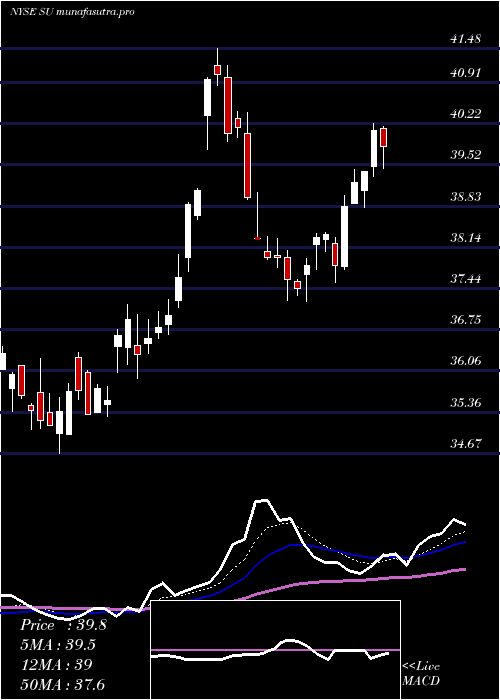
Daily price and charts and targets SuncorEnergy Strong Daily Stock price targets for SuncorEnergy SU are 38 and 38.53 | Daily Target 1 | 37.89 | | Daily Target 2 | 38.11 | | Daily Target 3 | 38.423333333333 | | Daily Target 4 | 38.64 | | Daily Target 5 | 38.95 |
Daily price and volume Suncor Energy
| Date |
Closing |
Open |
Range |
Volume |
Mon 20 October 2025 |
38.32 (-0.7%) |
38.65 |
38.21 - 38.74 |
1.3057 times |
Fri 17 October 2025 |
38.59 (0.03%) |
38.73 |
38.40 - 38.73 |
0.8303 times |
Thu 16 October 2025 |
38.58 (-1.33%) |
39.23 |
38.35 - 39.28 |
0.8899 times |
Wed 15 October 2025 |
39.10 (-0.66%) |
39.66 |
39.04 - 39.92 |
0.8652 times |
Tue 14 October 2025 |
39.36 (-1.53%) |
39.24 |
39.16 - 39.75 |
0.6567 times |
Mon 13 October 2025 |
39.97 (1.22%) |
39.91 |
39.62 - 40.05 |
0.5044 times |
Fri 10 October 2025 |
39.49 (-2.18%) |
40.02 |
39.36 - 40.19 |
1.2842 times |
Thu 09 October 2025 |
40.37 (-1.15%) |
41.08 |
40.37 - 41.37 |
0.7522 times |
Wed 08 October 2025 |
40.84 (-1.28%) |
41.40 |
40.10 - 41.40 |
2.1125 times |
Tue 07 October 2025 |
41.37 (-0.39%) |
41.42 |
40.92 - 41.78 |
0.7987 times |
Mon 06 October 2025 |
41.53 (0.44%) |
41.97 |
41.10 - 41.97 |
0.5631 times |
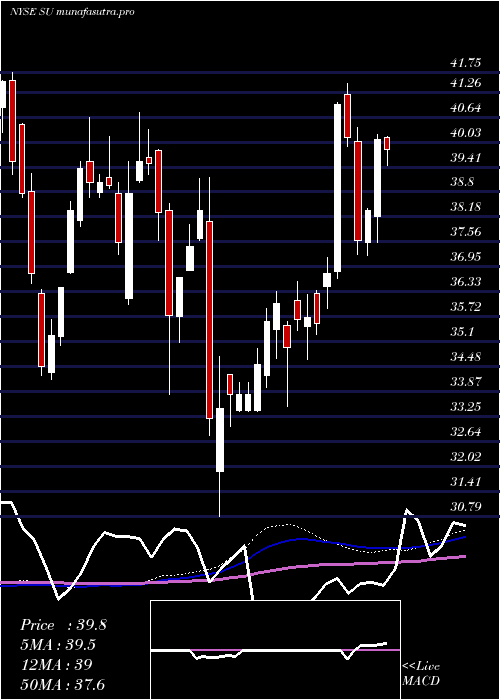
Weekly price and charts SuncorEnergy Strong weekly Stock price targets for SuncorEnergy SU are 38 and 38.53 | Weekly Target 1 | 37.89 | | Weekly Target 2 | 38.11 | | Weekly Target 3 | 38.423333333333 | | Weekly Target 4 | 38.64 | | Weekly Target 5 | 38.95 |
Weekly price and volumes for Suncor Energy
| Date |
Closing |
Open |
Range |
Volume |
Mon 20 October 2025 |
38.32 (-0.7%) |
38.65 |
38.21 - 38.74 |
0.2996 times |
Fri 17 October 2025 |
38.59 (-2.28%) |
39.91 |
38.35 - 40.05 |
0.8597 times |
Fri 10 October 2025 |
39.49 (-4.5%) |
41.97 |
39.36 - 41.97 |
1.2644 times |
Fri 03 October 2025 |
41.35 (-2.98%) |
42.34 |
41.06 - 42.41 |
0.8334 times |
Fri 26 September 2025 |
42.62 (2.58%) |
41.51 |
41.07 - 43.38 |
1.1905 times |
Fri 19 September 2025 |
41.55 (-0.41%) |
41.82 |
41.40 - 43.48 |
1.5663 times |
Fri 12 September 2025 |
41.72 (4.38%) |
40.10 |
39.59 - 42.40 |
1.0912 times |
Fri 05 September 2025 |
39.97 (-3.22%) |
41.27 |
39.61 - 41.54 |
1.459 times |
Fri 29 August 2025 |
41.30 (0%) |
41.52 |
41.21 - 41.76 |
0.2612 times |
Fri 29 August 2025 |
41.30 (3.28%) |
39.88 |
39.71 - 41.76 |
1.1747 times |
Fri 22 August 2025 |
39.99 (2.85%) |
38.59 |
38.25 - 40.00 |
1.5091 times |
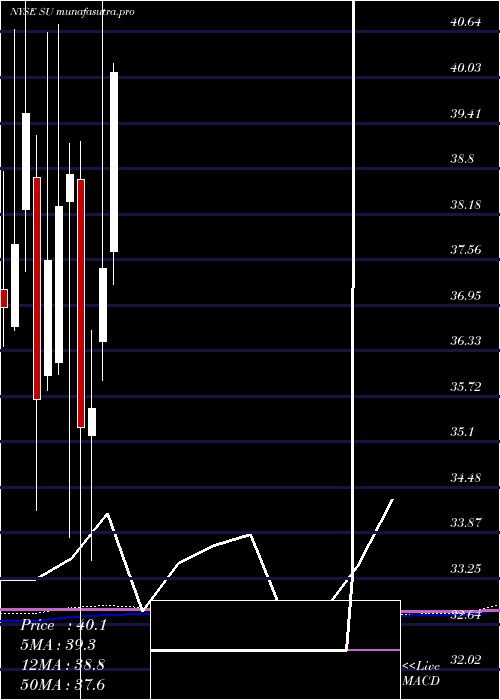
Monthly price and charts SuncorEnergy Strong monthly Stock price targets for SuncorEnergy SU are 36.38 and 40.15 | Monthly Target 1 | 35.73 | | Monthly Target 2 | 37.03 | | Monthly Target 3 | 39.503333333333 | | Monthly Target 4 | 40.8 | | Monthly Target 5 | 43.27 |
Monthly price and volumes Suncor Energy
| Date |
Closing |
Open |
Range |
Volume |
Mon 20 October 2025 |
38.32 (-8.35%) |
41.73 |
38.21 - 41.98 |
0.51 times |
Tue 30 September 2025 |
41.81 (1.23%) |
41.27 |
39.59 - 43.48 |
1.0309 times |
Fri 29 August 2025 |
41.30 (4.66%) |
39.31 |
38.25 - 41.76 |
0.881 times |
Thu 31 July 2025 |
39.46 (5.37%) |
37.68 |
37.23 - 40.22 |
0.8205 times |
Mon 30 June 2025 |
37.45 (5.34%) |
36.46 |
35.93 - 41.48 |
1.3424 times |
Fri 30 May 2025 |
35.55 (0.74%) |
35.18 |
33.50 - 36.60 |
1.1041 times |
Wed 30 April 2025 |
35.29 (-8.86%) |
38.65 |
30.79 - 39.16 |
1.1159 times |
Mon 31 March 2025 |
38.72 (1.15%) |
38.35 |
33.81 - 39.13 |
1.1972 times |
Fri 28 February 2025 |
38.28 (1.92%) |
36.18 |
36.01 - 40.75 |
0.9639 times |
Fri 31 January 2025 |
37.56 (5.27%) |
36.00 |
35.79 - 40.64 |
1.0342 times |
Tue 31 December 2024 |
35.68 (-9.76%) |
38.68 |
34.17 - 39.24 |
0.6335 times |
DMA SMA EMA moving averages of Suncor Energy SU
DMA (daily moving average) of Suncor Energy SU
| DMA period | DMA value | | 5 day DMA | 38.79 | | 12 day DMA | 39.91 | | 20 day DMA | 40.75 | | 35 day DMA | 41.1 | | 50 day DMA | 40.69 | | 100 day DMA | 39.64 | | 150 day DMA | 38.27 | | 200 day DMA | 38.26 | EMA (exponential moving average) of Suncor Energy SU
| EMA period | EMA current | EMA prev | EMA prev2 | | 5 day EMA | 38.83 | 39.08 | 39.32 | | 12 day EMA | 39.66 | 39.9 | 40.14 | | 20 day EMA | 40.17 | 40.36 | 40.55 | | 35 day EMA | 40.36 | 40.48 | 40.59 | | 50 day EMA | 40.37 | 40.45 | 40.53 |
SMA (simple moving average) of Suncor Energy SU
| SMA period | SMA current | SMA prev | SMA prev2 | | 5 day SMA | 38.79 | 39.12 | 39.3 | | 12 day SMA | 39.91 | 40.14 | 40.36 | | 20 day SMA | 40.75 | 40.93 | 41.07 | | 35 day SMA | 41.1 | 41.18 | 41.26 | | 50 day SMA | 40.69 | 40.7 | 40.71 | | 100 day SMA | 39.64 | 39.61 | 39.58 | | 150 day SMA | 38.27 | 38.26 | 38.24 | | 200 day SMA | 38.26 | 38.25 | 38.24 |
|
|
