QuestarCorp STR full analysis,charts,indicators,moving averages,SMA,DMA,EMA,ADX,MACD,RSIQuestar Corp STR WideScreen charts, DMA,SMA,EMA technical analysis, forecast prediction, by indicators ADX,MACD,RSI,CCI NYSE stock exchange
Daily price and charts and targets QuestarCorp Strong Daily Stock price targets for QuestarCorp STR are 17.75 and 18.07 | Daily Target 1 | 17.69 | | Daily Target 2 | 17.81 | | Daily Target 3 | 18.006666666667 | | Daily Target 4 | 18.13 | | Daily Target 5 | 18.33 |
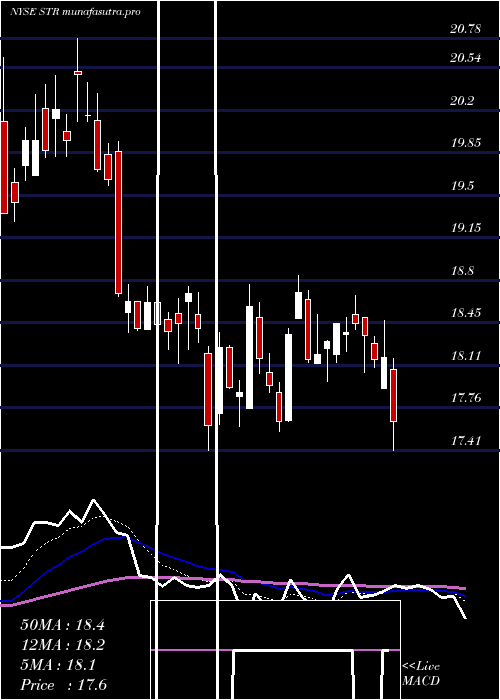
Daily price and volume Questar Corp
| Date |
Closing |
Open |
Range |
Volume |
Tue 15 July 2025 |
17.94 (-1.21%) |
18.05 |
17.88 - 18.20 |
0.723 times |
Mon 14 July 2025 |
18.16 (-2.31%) |
18.50 |
18.04 - 18.62 |
0.7715 times |
Fri 11 July 2025 |
18.59 (3.97%) |
17.75 |
17.75 - 18.77 |
0.8599 times |
Thu 10 July 2025 |
17.88 (-0.22%) |
17.85 |
17.60 - 17.98 |
1.0993 times |
Wed 09 July 2025 |
17.92 (-1.81%) |
18.25 |
17.91 - 18.27 |
0.8623 times |
Tue 08 July 2025 |
18.25 (3.63%) |
17.71 |
17.62 - 18.37 |
1.1716 times |
Mon 07 July 2025 |
17.61 (-4.35%) |
18.20 |
17.41 - 18.26 |
2.0815 times |
Thu 03 July 2025 |
18.41 (-1.5%) |
18.52 |
18.29 - 18.70 |
0.8313 times |
Wed 02 July 2025 |
18.69 (1.3%) |
18.63 |
18.23 - 18.75 |
0.7638 times |
Tue 01 July 2025 |
18.45 (0.38%) |
18.53 |
18.12 - 18.65 |
0.8358 times |
Mon 30 June 2025 |
18.38 (-0.33%) |
18.48 |
18.23 - 18.54 |
1.2814 times |
Weekly price and charts QuestarCorp Strong weekly Stock price targets for QuestarCorp STR are 17.54 and 18.28 | Weekly Target 1 | 17.41 | | Weekly Target 2 | 17.67 | | Weekly Target 3 | 18.146666666667 | | Weekly Target 4 | 18.41 | | Weekly Target 5 | 18.89 |
Weekly price and volumes for Questar Corp
| Date |
Closing |
Open |
Range |
Volume |
Tue 15 July 2025 |
17.94 (-3.5%) |
18.50 |
17.88 - 18.62 |
0.3308 times |
Fri 11 July 2025 |
18.59 (0.98%) |
18.20 |
17.41 - 18.77 |
1.3444 times |
Thu 03 July 2025 |
18.41 (-0.16%) |
18.48 |
18.12 - 18.75 |
0.8216 times |
Fri 27 June 2025 |
18.44 (-6.06%) |
19.86 |
18.37 - 19.94 |
0.9338 times |
Fri 20 June 2025 |
19.63 (-4.2%) |
20.15 |
19.58 - 20.42 |
0.5979 times |
Fri 13 June 2025 |
20.49 (2.71%) |
19.66 |
19.66 - 20.78 |
1.566 times |
Fri 06 June 2025 |
19.95 (16.87%) |
17.46 |
17.20 - 20.63 |
3.1825 times |
Fri 30 May 2025 |
17.07 (-0.64%) |
17.38 |
16.81 - 17.80 |
0.3846 times |
Fri 23 May 2025 |
17.18 (-6.02%) |
18.00 |
16.70 - 18.09 |
0.3686 times |
Fri 16 May 2025 |
18.28 (2.41%) |
18.50 |
18.12 - 19.03 |
0.4697 times |
Fri 09 May 2025 |
17.85 (2.76%) |
17.09 |
16.75 - 18.50 |
0.6515 times |

Monthly price and charts QuestarCorp Strong monthly Stock price targets for QuestarCorp STR are 17 and 18.36 | Monthly Target 1 | 16.68 | | Monthly Target 2 | 17.31 | | Monthly Target 3 | 18.04 | | Monthly Target 4 | 18.67 | | Monthly Target 5 | 19.4 |
Monthly price and volumes Questar Corp
| Date |
Closing |
Open |
Range |
Volume |
Tue 15 July 2025 |
17.94 (-2.39%) |
18.53 |
17.41 - 18.77 |
0.7986 times |
Mon 30 June 2025 |
18.38 (7.67%) |
17.46 |
17.20 - 20.78 |
2.3684 times |
Fri 30 May 2025 |
17.07 (0.65%) |
16.97 |
16.70 - 19.03 |
0.741 times |
Wed 30 April 2025 |
16.96 (-14.65%) |
19.85 |
14.58 - 20.30 |
0.9744 times |
Mon 31 March 2025 |
19.87 (-0.65%) |
20.20 |
18.55 - 20.93 |
0.9104 times |
Fri 28 February 2025 |
20.00 (-0.7%) |
20.11 |
18.90 - 20.58 |
0.6798 times |
Fri 31 January 2025 |
20.14 (5.01%) |
19.42 |
19.37 - 22.18 |
0.7884 times |
Tue 31 December 2024 |
19.18 (-18.93%) |
23.06 |
18.40 - 23.06 |
0.8055 times |
Tue 26 November 2024 |
23.66 (6.15%) |
22.47 |
21.98 - 25.52 |
1.0381 times |
Thu 31 October 2024 |
22.29 (6.96%) |
20.80 |
20.66 - 23.75 |
0.8954 times |
Mon 30 September 2024 |
20.84 (-6.25%) |
21.80 |
19.88 - 22.38 |
0.7221 times |

DMA SMA EMA moving averages of Questar Corp STR
DMA (daily moving average) of Questar Corp STR
| DMA period | DMA value | | 5 day DMA | 18.1 | | 12 day DMA | 18.23 | | 20 day DMA | 18.65 | | 35 day DMA | 18.64 | | 50 day DMA | 18.39 | | 100 day DMA | 18.41 | | 150 day DMA | 19.1 | | 200 day DMA | 20.03 | EMA (exponential moving average) of Questar Corp STR
| EMA period | EMA current | EMA prev | EMA prev2 | | 5 day EMA | 18.12 | 18.21 | 18.23 | | 12 day EMA | 18.29 | 18.35 | 18.39 | | 20 day EMA | 18.43 | 18.48 | 18.51 | | 35 day EMA | 18.35 | 18.37 | 18.38 | | 50 day EMA | 18.27 | 18.28 | 18.28 |
SMA (simple moving average) of Questar Corp STR
| SMA period | SMA current | SMA prev | SMA prev2 | | 5 day SMA | 18.1 | 18.16 | 18.05 | | 12 day SMA | 18.23 | 18.28 | 18.3 | | 20 day SMA | 18.65 | 18.75 | 18.86 | | 35 day SMA | 18.64 | 18.62 | 18.6 | | 50 day SMA | 18.39 | 18.37 | 18.36 | | 100 day SMA | 18.41 | 18.43 | 18.44 | | 150 day SMA | 19.1 | 19.14 | 19.18 | | 200 day SMA | 20.03 | 20.05 | 20.07 |
|
|
