Sasol SSL full analysis,charts,indicators,moving averages,SMA,DMA,EMA,ADX,MACD,RSISasol SSL WideScreen charts, DMA,SMA,EMA technical analysis, forecast prediction, by indicators ADX,MACD,RSI,CCI NYSE stock exchange
operates under Energy sector & deals in Oil Gas Production
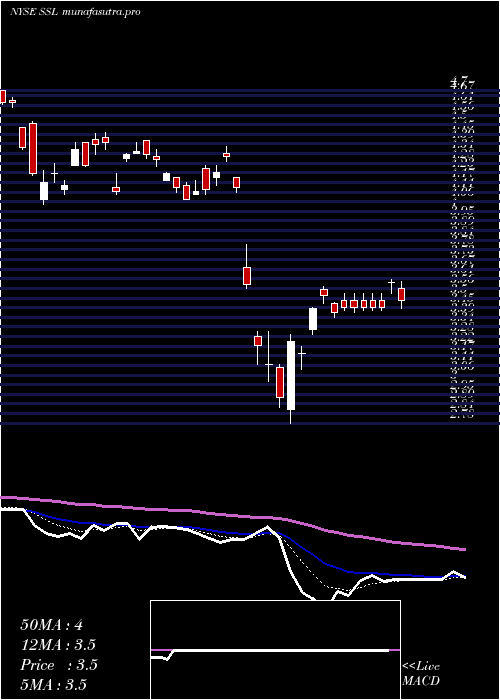
Daily price and charts and targets Sasol Strong Daily Stock price targets for Sasol SSL are 5.45 and 5.58 | Daily Target 1 | 5.43 | | Daily Target 2 | 5.47 | | Daily Target 3 | 5.5566666666667 | | Daily Target 4 | 5.6 | | Daily Target 5 | 5.69 |
Daily price and volume Sasol
| Date |
Closing |
Open |
Range |
Volume |
Mon 20 October 2025 |
5.52 (0.73%) |
5.55 |
5.51 - 5.64 |
0.9814 times |
Fri 17 October 2025 |
5.48 (-6.64%) |
5.51 |
5.43 - 5.58 |
1.426 times |
Thu 16 October 2025 |
5.87 (-0.84%) |
5.92 |
5.84 - 5.98 |
0.6927 times |
Wed 15 October 2025 |
5.92 (0.34%) |
5.92 |
5.88 - 5.97 |
0.8926 times |
Tue 14 October 2025 |
5.90 (1.72%) |
5.85 |
5.85 - 5.95 |
1.1213 times |
Mon 13 October 2025 |
5.80 (3.02%) |
5.81 |
5.77 - 5.83 |
0.9643 times |
Fri 10 October 2025 |
5.63 (-4.58%) |
5.84 |
5.63 - 5.85 |
0.9797 times |
Thu 09 October 2025 |
5.90 (-1.34%) |
6.06 |
5.89 - 6.12 |
0.8103 times |
Wed 08 October 2025 |
5.98 (0.34%) |
5.94 |
5.91 - 6.03 |
0.9826 times |
Tue 07 October 2025 |
5.96 (-4.64%) |
6.05 |
5.93 - 6.06 |
1.1491 times |
Mon 06 October 2025 |
6.25 (0%) |
6.12 |
6.11 - 6.25 |
1.1135 times |
Weekly price and charts Sasol Strong weekly Stock price targets for Sasol SSL are 5.45 and 5.58 | Weekly Target 1 | 5.43 | | Weekly Target 2 | 5.47 | | Weekly Target 3 | 5.5566666666667 | | Weekly Target 4 | 5.6 | | Weekly Target 5 | 5.69 |
Weekly price and volumes for Sasol
| Date |
Closing |
Open |
Range |
Volume |
Mon 20 October 2025 |
5.52 (0.73%) |
5.55 |
5.51 - 5.64 |
0.1988 times |
Fri 17 October 2025 |
5.48 (-2.66%) |
5.81 |
5.43 - 5.98 |
1.0322 times |
Fri 10 October 2025 |
5.63 (-9.92%) |
6.12 |
5.63 - 6.25 |
1.0197 times |
Fri 03 October 2025 |
6.25 (-0.48%) |
6.29 |
6.03 - 6.29 |
0.9365 times |
Fri 26 September 2025 |
6.28 (-5.42%) |
6.15 |
6.11 - 6.30 |
1.489 times |
Fri 19 September 2025 |
6.64 (-5.28%) |
6.96 |
6.54 - 6.97 |
1.1693 times |
Fri 12 September 2025 |
7.01 (-1.13%) |
7.18 |
6.88 - 7.19 |
0.9073 times |
Fri 05 September 2025 |
7.09 (5.19%) |
6.89 |
6.84 - 7.25 |
1.3071 times |
Fri 29 August 2025 |
6.74 (0%) |
6.77 |
6.70 - 6.80 |
0.1447 times |
Fri 29 August 2025 |
6.74 (7.15%) |
6.74 |
6.47 - 7.05 |
1.7952 times |
Fri 22 August 2025 |
6.29 (9.58%) |
5.74 |
5.72 - 6.29 |
1.2509 times |

Monthly price and charts Sasol Strong monthly Stock price targets for Sasol SSL are 5.07 and 5.89 | Monthly Target 1 | 4.91 | | Monthly Target 2 | 5.22 | | Monthly Target 3 | 5.7333333333333 | | Monthly Target 4 | 6.04 | | Monthly Target 5 | 6.55 |
Monthly price and volumes Sasol
| Date |
Closing |
Open |
Range |
Volume |
Mon 20 October 2025 |
5.52 (-11.25%) |
6.19 |
5.43 - 6.25 |
0.5901 times |
Tue 30 September 2025 |
6.22 (-7.72%) |
6.89 |
6.11 - 7.25 |
1.1032 times |
Fri 29 August 2025 |
6.74 (31.64%) |
4.98 |
4.77 - 7.05 |
1.1823 times |
Thu 31 July 2025 |
5.12 (15.84%) |
4.44 |
4.41 - 5.50 |
1.0895 times |
Mon 30 June 2025 |
4.42 (-0.45%) |
4.58 |
4.30 - 5.52 |
1.0743 times |
Fri 30 May 2025 |
4.44 (27.59%) |
3.46 |
3.41 - 4.77 |
0.8912 times |
Wed 30 April 2025 |
3.48 (-17.73%) |
4.34 |
2.78 - 4.38 |
1.3008 times |
Mon 31 March 2025 |
4.23 (-3.2%) |
4.51 |
4.04 - 4.52 |
0.6557 times |
Fri 28 February 2025 |
4.37 (-7.02%) |
4.71 |
4.20 - 4.89 |
0.803 times |
Fri 31 January 2025 |
4.70 (3.07%) |
4.68 |
4.29 - 5.55 |
1.31 times |
Tue 31 December 2024 |
4.56 (-11.63%) |
5.06 |
4.38 - 5.53 |
0.6554 times |

DMA SMA EMA moving averages of Sasol SSL
DMA (daily moving average) of Sasol SSL
| DMA period | DMA value | | 5 day DMA | 5.74 | | 12 day DMA | 5.87 | | 20 day DMA | 6 | | 35 day DMA | 6.39 | | 50 day DMA | 6.33 | | 100 day DMA | 5.64 | | 150 day DMA | 5.01 | | 200 day DMA | 4.91 | EMA (exponential moving average) of Sasol SSL
| EMA period | EMA current | EMA prev | EMA prev2 | | 5 day EMA | 5.67 | 5.75 | 5.88 | | 12 day EMA | 5.85 | 5.91 | 5.99 | | 20 day EMA | 5.97 | 6.02 | 6.08 | | 35 day EMA | 6.05 | 6.08 | 6.12 | | 50 day EMA | 6.16 | 6.19 | 6.22 |
SMA (simple moving average) of Sasol SSL
| SMA period | SMA current | SMA prev | SMA prev2 | | 5 day SMA | 5.74 | 5.79 | 5.82 | | 12 day SMA | 5.87 | 5.91 | 5.98 | | 20 day SMA | 6 | 6.03 | 6.09 | | 35 day SMA | 6.39 | 6.42 | 6.46 | | 50 day SMA | 6.33 | 6.32 | 6.31 | | 100 day SMA | 5.64 | 5.63 | 5.62 | | 150 day SMA | 5.01 | 5 | 4.99 | | 200 day SMA | 4.91 | 4.91 | 4.9 |
|
|
