SempraEnergy SREA full analysis,charts,indicators,moving averages,SMA,DMA,EMA,ADX,MACD,RSISempra Energy SREA WideScreen charts, DMA,SMA,EMA technical analysis, forecast prediction, by indicators ADX,MACD,RSI,CCI NYSE stock exchange
Daily price and charts and targets SempraEnergy Strong Daily Stock price targets for SempraEnergy SREA are 23.2 and 23.4 | Daily Target 1 | 23.04 | | Daily Target 2 | 23.16 | | Daily Target 3 | 23.236666666667 | | Daily Target 4 | 23.36 | | Daily Target 5 | 23.44 |
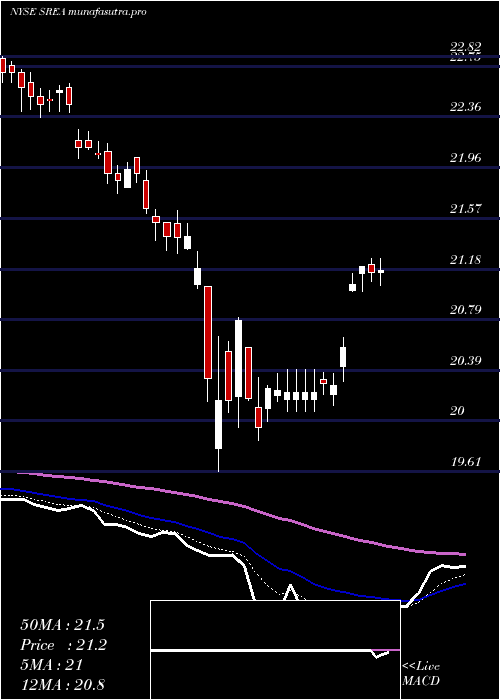
Daily price and volume Sempra Energy
| Date |
Closing |
Open |
Range |
Volume |
Tue 21 October 2025 |
23.29 (0.87%) |
23.11 |
23.11 - 23.31 |
0.8091 times |
Mon 20 October 2025 |
23.09 (1.09%) |
22.83 |
22.83 - 23.10 |
0.7231 times |
Fri 17 October 2025 |
22.84 (0.84%) |
22.67 |
22.60 - 22.86 |
0.704 times |
Thu 16 October 2025 |
22.65 (0.22%) |
22.69 |
22.60 - 22.77 |
0.5752 times |
Wed 15 October 2025 |
22.60 (-2.59%) |
22.67 |
22.36 - 22.90 |
1.9594 times |
Tue 07 October 2025 |
23.20 (0.65%) |
23.07 |
23.04 - 23.20 |
1.2697 times |
Mon 06 October 2025 |
23.05 (-0.3%) |
23.15 |
23.00 - 23.16 |
0.5584 times |
Fri 03 October 2025 |
23.12 (0.04%) |
23.15 |
23.05 - 23.22 |
1.5155 times |
Thu 02 October 2025 |
23.11 (-0.09%) |
23.19 |
23.08 - 23.23 |
0.6804 times |
Wed 01 October 2025 |
23.13 (1.18%) |
22.96 |
22.90 - 23.15 |
1.2052 times |
Tue 30 September 2025 |
22.86 (-2.14%) |
23.45 |
22.63 - 23.60 |
3.2816 times |
Weekly price and charts SempraEnergy Strong weekly Stock price targets for SempraEnergy SREA are 23.06 and 23.54 | Weekly Target 1 | 22.66 | | Weekly Target 2 | 22.98 | | Weekly Target 3 | 23.143333333333 | | Weekly Target 4 | 23.46 | | Weekly Target 5 | 23.62 |
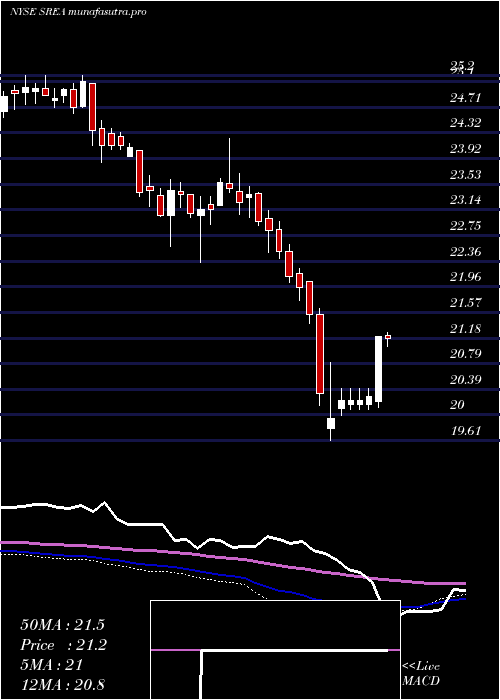
Weekly price and volumes for Sempra Energy
| Date |
Closing |
Open |
Range |
Volume |
Tue 21 October 2025 |
23.29 (1.97%) |
22.83 |
22.83 - 23.31 |
0.306 times |
Fri 17 October 2025 |
22.84 (-1.21%) |
23.15 |
22.36 - 23.20 |
1.012 times |
Fri 03 October 2025 |
23.12 (-1.83%) |
23.56 |
22.63 - 23.62 |
1.445 times |
Fri 26 September 2025 |
23.55 (0.47%) |
23.51 |
23.21 - 23.65 |
0.9143 times |
Fri 19 September 2025 |
23.44 (-0.89%) |
23.40 |
22.94 - 23.61 |
1.4158 times |
Fri 12 September 2025 |
23.65 (0.81%) |
23.58 |
23.41 - 23.84 |
1.0249 times |
Fri 05 September 2025 |
23.46 (3.53%) |
22.61 |
22.61 - 23.50 |
0.6407 times |
Fri 29 August 2025 |
22.66 (0%) |
23.20 |
22.56 - 23.22 |
0.758 times |
Fri 29 August 2025 |
22.66 (-2.66%) |
23.28 |
22.56 - 23.45 |
1.5059 times |
Fri 22 August 2025 |
23.28 (3.42%) |
22.51 |
22.39 - 23.40 |
0.9773 times |
Fri 15 August 2025 |
22.51 (1.95%) |
22.07 |
21.99 - 22.88 |
0.91 times |
Monthly price and charts SempraEnergy Strong monthly Stock price targets for SempraEnergy SREA are 22.83 and 23.78 | Monthly Target 1 | 22.04 | | Monthly Target 2 | 22.66 | | Monthly Target 3 | 22.986666666667 | | Monthly Target 4 | 23.61 | | Monthly Target 5 | 23.94 |
Monthly price and volumes Sempra Energy
| Date |
Closing |
Open |
Range |
Volume |
Tue 21 October 2025 |
23.29 (1.88%) |
22.96 |
22.36 - 23.31 |
0.3468 times |
Tue 30 September 2025 |
22.86 (0.88%) |
22.61 |
22.61 - 23.84 |
0.8266 times |
Fri 29 August 2025 |
22.66 (2.12%) |
22.14 |
21.83 - 23.45 |
0.8903 times |
Thu 31 July 2025 |
22.19 (7.98%) |
20.68 |
20.63 - 22.46 |
1.1095 times |
Mon 30 June 2025 |
20.55 (-3.02%) |
21.18 |
20.00 - 21.58 |
0.7607 times |
Fri 30 May 2025 |
21.19 (1.68%) |
20.94 |
20.11 - 21.26 |
1.3041 times |
Wed 30 April 2025 |
20.84 (-2.75%) |
21.53 |
19.61 - 21.63 |
1.471 times |
Mon 31 March 2025 |
21.43 (-6.09%) |
22.84 |
21.32 - 22.96 |
1.2299 times |
Fri 28 February 2025 |
22.82 (-2.73%) |
23.42 |
22.48 - 23.69 |
0.8424 times |
Fri 31 January 2025 |
23.46 (3.35%) |
22.90 |
22.33 - 24.23 |
1.2186 times |
Tue 31 December 2024 |
22.70 (-5.93%) |
23.96 |
22.58 - 24.16 |
1.5751 times |

DMA SMA EMA moving averages of Sempra Energy SREA
DMA (daily moving average) of Sempra Energy SREA
| DMA period | DMA value | | 5 day DMA | 22.89 | | 12 day DMA | 23.03 | | 20 day DMA | 23.17 | | 35 day DMA | 23.19 | | 50 day DMA | 23.04 | | 100 day DMA | 22.12 | | 150 day DMA | 21.73 | | 200 day DMA | 22.09 | EMA (exponential moving average) of Sempra Energy SREA
| EMA period | EMA current | EMA prev | EMA prev2 | | 5 day EMA | 23.05 | 22.93 | 22.85 | | 12 day EMA | 23.06 | 23.02 | 23.01 | | 20 day EMA | 23.1 | 23.08 | 23.08 | | 35 day EMA | 23.03 | 23.01 | 23.01 | | 50 day EMA | 22.97 | 22.96 | 22.95 |
SMA (simple moving average) of Sempra Energy SREA
| SMA period | SMA current | SMA prev | SMA prev2 | | 5 day SMA | 22.89 | 22.88 | 22.87 | | 12 day SMA | 23.03 | 23.05 | 23.07 | | 20 day SMA | 23.17 | 23.16 | 23.18 | | 35 day SMA | 23.19 | 23.18 | 23.19 | | 50 day SMA | 23.04 | 23.02 | 23 | | 100 day SMA | 22.12 | 22.09 | 22.07 | | 150 day SMA | 21.73 | 21.73 | 21.72 | | 200 day SMA | 22.09 | 22.09 | 22.09 |
|
|
