SempraEnergy SRE full analysis,charts,indicators,moving averages,SMA,DMA,EMA,ADX,MACD,RSISempra Energy SRE WideScreen charts, DMA,SMA,EMA technical analysis, forecast prediction, by indicators ADX,MACD,RSI,CCI NYSE stock exchange
operates under Public Utilities sector & deals in Natural Gas Distribution
Daily price and charts and targets SempraEnergy Strong Daily Stock price targets for SempraEnergy SRE are 89.13 and 90.75 | Daily Target 1 | 88.81 | | Daily Target 2 | 89.44 | | Daily Target 3 | 90.43 | | Daily Target 4 | 91.06 | | Daily Target 5 | 92.05 |
Daily price and volume Sempra Energy
| Date |
Closing |
Open |
Range |
Volume |
Thu 04 December 2025 |
90.07 (-0.73%) |
90.45 |
89.80 - 91.42 |
1.1555 times |
Wed 03 December 2025 |
90.73 (-0.24%) |
91.08 |
90.31 - 91.13 |
0.5835 times |
Tue 02 December 2025 |
90.95 (-0.6%) |
91.64 |
90.26 - 91.75 |
0.7865 times |
Mon 01 December 2025 |
91.50 (-3.4%) |
93.88 |
91.37 - 94.28 |
1.0573 times |
Fri 28 November 2025 |
94.72 (0.99%) |
93.77 |
93.16 - 94.73 |
0.2958 times |
Wed 26 November 2025 |
93.79 (1.43%) |
92.99 |
92.62 - 94.00 |
0.6292 times |
Tue 25 November 2025 |
92.47 (-1.53%) |
93.91 |
92.34 - 93.91 |
0.7809 times |
Mon 24 November 2025 |
93.91 (1.52%) |
92.50 |
91.97 - 95.04 |
3.0468 times |
Fri 21 November 2025 |
92.50 (1.97%) |
91.31 |
90.54 - 92.86 |
1.0702 times |
Thu 20 November 2025 |
90.71 (-0.34%) |
91.81 |
90.67 - 92.82 |
0.5943 times |
Wed 19 November 2025 |
91.02 (-0.63%) |
91.90 |
90.99 - 92.01 |
0.8236 times |
Weekly price and charts SempraEnergy Strong weekly Stock price targets for SempraEnergy SRE are 87.7 and 92.18 | Weekly Target 1 | 86.9 | | Weekly Target 2 | 88.49 | | Weekly Target 3 | 91.383333333333 | | Weekly Target 4 | 92.97 | | Weekly Target 5 | 95.86 |
Weekly price and volumes for Sempra Energy
| Date |
Closing |
Open |
Range |
Volume |
Thu 04 December 2025 |
90.07 (-4.91%) |
93.88 |
89.80 - 94.28 |
1.0029 times |
Fri 28 November 2025 |
94.72 (2.4%) |
92.50 |
91.97 - 95.04 |
1.3305 times |
Fri 21 November 2025 |
92.50 (0.54%) |
92.38 |
90.54 - 92.86 |
1.2784 times |
Fri 14 November 2025 |
92.00 (-1.84%) |
93.95 |
90.38 - 94.13 |
1.2954 times |
Fri 07 November 2025 |
93.72 (1.94%) |
92.30 |
90.84 - 94.75 |
1.0086 times |
Fri 31 October 2025 |
91.94 (0%) |
91.69 |
91.03 - 92.45 |
0.1957 times |
Fri 31 October 2025 |
91.94 (-0.91%) |
92.82 |
91.03 - 93.87 |
0.793 times |
Fri 24 October 2025 |
92.78 (1.63%) |
92.35 |
91.38 - 93.66 |
0.858 times |
Fri 17 October 2025 |
91.29 (1.21%) |
90.37 |
89.99 - 92.94 |
0.9594 times |
Fri 10 October 2025 |
90.20 (-1.36%) |
91.01 |
90.10 - 95.72 |
1.2783 times |
Fri 03 October 2025 |
91.44 (3.22%) |
88.81 |
88.29 - 91.99 |
1.102 times |
Monthly price and charts SempraEnergy Strong monthly Stock price targets for SempraEnergy SRE are 87.7 and 92.18 | Monthly Target 1 | 86.9 | | Monthly Target 2 | 88.49 | | Monthly Target 3 | 91.383333333333 | | Monthly Target 4 | 92.97 | | Monthly Target 5 | 95.86 |
Monthly price and volumes Sempra Energy
| Date |
Closing |
Open |
Range |
Volume |
Thu 04 December 2025 |
90.07 (-4.91%) |
93.88 |
89.80 - 94.28 |
0.2025 times |
Fri 28 November 2025 |
94.72 (3.02%) |
92.30 |
90.38 - 95.04 |
0.9921 times |
Fri 31 October 2025 |
91.94 (2.18%) |
89.45 |
88.43 - 95.72 |
0.9502 times |
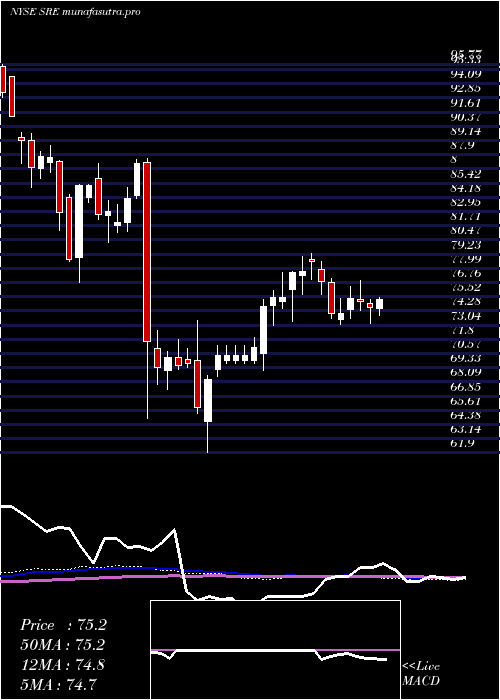
Tue 30 September 2025 |
89.98 (8.99%) |
82.00 |
78.97 - 90.53 |
1.3147 times |
Fri 29 August 2025 |
82.56 (1.08%) |
81.66 |
80.39 - 83.50 |
0.9416 times |
Thu 31 July 2025 |
81.68 (7.8%) |
75.53 |
73.18 - 82.15 |
0.9147 times |
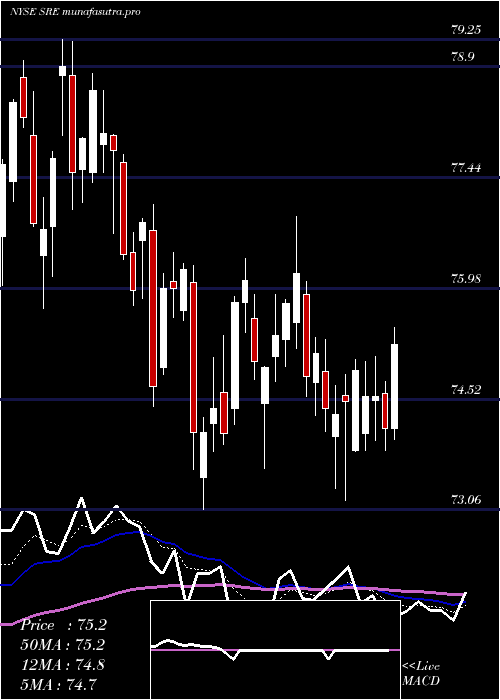
Mon 30 June 2025 |
75.77 (-3.59%) |
77.88 |
73.06 - 78.59 |
1.0324 times |
Fri 30 May 2025 |
78.59 (5.82%) |
74.38 |
73.33 - 79.25 |
1.0212 times |
Wed 30 April 2025 |
74.27 (4.08%) |
71.09 |
61.90 - 76.06 |
1.2479 times |
Mon 31 March 2025 |
71.36 (-0.29%) |
71.01 |
67.46 - 72.58 |
1.3826 times |
Fri 28 February 2025 |
71.57 (-13.7%) |
81.74 |
64.89 - 87.60 |
1.4952 times |

DMA SMA EMA moving averages of Sempra Energy SRE
DMA (daily moving average) of Sempra Energy SRE
| DMA period | DMA value | | 5 day DMA | 91.59 | | 12 day DMA | 92 | | 20 day DMA | 92.29 | | 35 day DMA | 92.26 | | 50 day DMA | 91.8 | | 100 day DMA | 86.7 | | 150 day DMA | 83.09 | | 200 day DMA | 80.18 | EMA (exponential moving average) of Sempra Energy SRE
| EMA period | EMA current | EMA prev | EMA prev2 | | 5 day EMA | 91.17 | 91.72 | 92.22 | | 12 day EMA | 91.83 | 92.15 | 92.41 | | 20 day EMA | 91.96 | 92.16 | 92.31 | | 35 day EMA | 91.59 | 91.68 | 91.74 | | 50 day EMA | 91.15 | 91.19 | 91.21 |
SMA (simple moving average) of Sempra Energy SRE
| SMA period | SMA current | SMA prev | SMA prev2 | | 5 day SMA | 91.59 | 92.34 | 92.69 | | 12 day SMA | 92 | 92.18 | 92.28 | | 20 day SMA | 92.29 | 92.41 | 92.5 | | 35 day SMA | 92.26 | 92.32 | 92.34 | | 50 day SMA | 91.8 | 91.75 | 91.66 | | 100 day SMA | 86.7 | 86.55 | 86.38 | | 150 day SMA | 83.09 | 82.99 | 82.88 | | 200 day SMA | 80.18 | 80.16 | 80.12 |
|
|
