SourceCapital SOR full analysis,charts,indicators,moving averages,SMA,DMA,EMA,ADX,MACD,RSISource Capital SOR WideScreen charts, DMA,SMA,EMA technical analysis, forecast prediction, by indicators ADX,MACD,RSI,CCI NYSE stock exchange
operates under N A sector & deals in N A
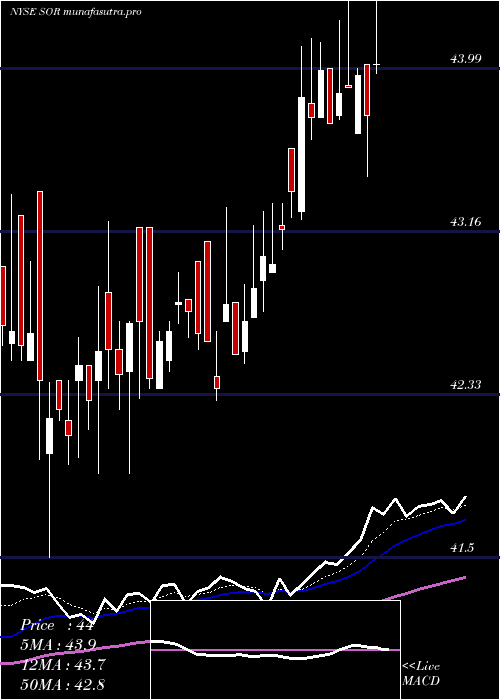
Daily price and charts and targets SourceCapital Strong Daily Stock price targets for SourceCapital SOR are 46.32 and 47.75 | Daily Target 1 | 46.08 | | Daily Target 2 | 46.55 | | Daily Target 3 | 47.506666666667 | | Daily Target 4 | 47.98 | | Daily Target 5 | 48.94 |
Daily price and volume Source Capital
| Date |
Closing |
Open |
Range |
Volume |
Fri 05 December 2025 |
47.03 (-1.03%) |
47.98 |
47.03 - 48.46 |
1.178 times |
Thu 04 December 2025 |
47.52 (-2.42%) |
48.70 |
47.50 - 48.70 |
0.6112 times |
Wed 03 December 2025 |
48.70 (0.35%) |
48.27 |
48.20 - 50.41 |
1.7715 times |
Tue 02 December 2025 |
48.53 (-0.12%) |
48.59 |
48.25 - 48.62 |
0.9212 times |
Mon 01 December 2025 |
48.59 (-0.31%) |
48.60 |
48.00 - 48.65 |
0.93 times |
Fri 28 November 2025 |
48.74 (2.14%) |
48.86 |
48.11 - 49.71 |
0.992 times |
Wed 26 November 2025 |
47.72 (1.51%) |
47.21 |
46.22 - 47.72 |
0.7795 times |
Tue 25 November 2025 |
47.01 (0.69%) |
46.66 |
46.60 - 47.30 |
0.9566 times |
Mon 24 November 2025 |
46.69 (0.11%) |
46.57 |
46.30 - 47.39 |
0.6112 times |
Fri 21 November 2025 |
46.64 (2.44%) |
45.33 |
45.33 - 46.90 |
1.2489 times |
Thu 20 November 2025 |
45.53 (-0.63%) |
45.56 |
45.30 - 46.38 |
0.3366 times |
Weekly price and charts SourceCapital Strong weekly Stock price targets for SourceCapital SOR are 45.34 and 48.72 | Weekly Target 1 | 44.78 | | Weekly Target 2 | 45.9 | | Weekly Target 3 | 48.156666666667 | | Weekly Target 4 | 49.28 | | Weekly Target 5 | 51.54 |
Weekly price and volumes for Source Capital
| Date |
Closing |
Open |
Range |
Volume |
Fri 05 December 2025 |
47.03 (-3.51%) |
48.60 |
47.03 - 50.41 |
1.5834 times |
Fri 28 November 2025 |
48.74 (4.5%) |
46.57 |
46.22 - 49.71 |
0.977 times |
Fri 21 November 2025 |
46.64 (2.44%) |
45.22 |
45.06 - 46.90 |
0.8759 times |
Fri 14 November 2025 |
45.53 (0.37%) |
45.43 |
45.21 - 46.47 |
0.8733 times |
Fri 07 November 2025 |
45.36 (-0.5%) |
45.75 |
45.20 - 46.01 |
0.6919 times |
Fri 31 October 2025 |
45.59 (0%) |
46.00 |
45.01 - 46.00 |
0.2203 times |
Fri 31 October 2025 |
45.59 (-0.09%) |
46.00 |
44.96 - 46.00 |
1.2932 times |
Fri 24 October 2025 |
45.63 (1.22%) |
45.17 |
44.90 - 45.99 |
1.3061 times |
Fri 17 October 2025 |
45.08 (-0.57%) |
46.04 |
44.85 - 46.05 |
0.8785 times |
Fri 10 October 2025 |
45.34 (0.6%) |
45.09 |
44.79 - 47.00 |
1.3003 times |
Fri 03 October 2025 |
45.07 (0.76%) |
44.90 |
44.59 - 45.80 |
1.3178 times |
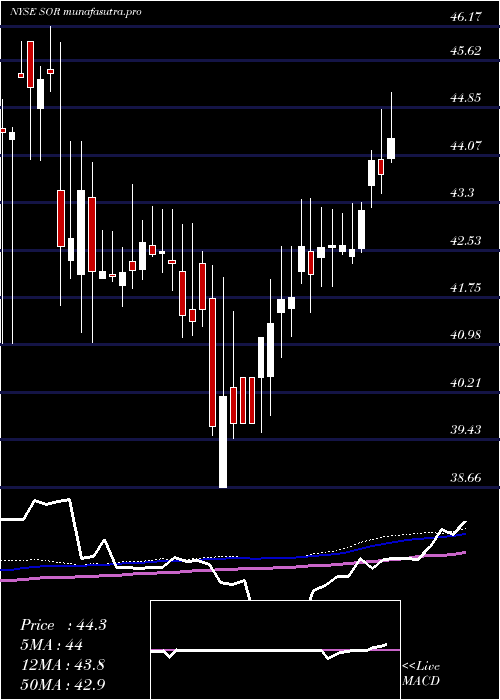
Monthly price and charts SourceCapital Strong monthly Stock price targets for SourceCapital SOR are 45.34 and 48.72 | Monthly Target 1 | 44.78 | | Monthly Target 2 | 45.9 | | Monthly Target 3 | 48.156666666667 | | Monthly Target 4 | 49.28 | | Monthly Target 5 | 51.54 |
Monthly price and volumes Source Capital
| Date |
Closing |
Open |
Range |
Volume |
Fri 05 December 2025 |
47.03 (-3.51%) |
48.60 |
47.03 - 50.41 |
0.3056 times |
Fri 28 November 2025 |
48.74 (6.91%) |
45.75 |
45.06 - 49.71 |
0.6597 times |
Fri 31 October 2025 |
45.59 (1.27%) |
45.19 |
44.79 - 47.00 |
1.0925 times |
Tue 30 September 2025 |
45.02 (1.17%) |
44.49 |
44.11 - 45.82 |
1.0158 times |
Fri 29 August 2025 |
44.50 (1.99%) |
43.69 |
43.16 - 44.91 |
0.8063 times |
Thu 31 July 2025 |
43.63 (0.62%) |
43.26 |
41.98 - 45.09 |
1.2585 times |
Mon 30 June 2025 |
43.36 (1.88%) |
42.56 |
41.93 - 43.58 |
0.9998 times |
Fri 30 May 2025 |
42.56 (3.45%) |
41.20 |
41.11 - 43.36 |
1.1659 times |
Wed 30 April 2025 |
41.14 (-0.89%) |
41.44 |
38.66 - 42.46 |
1.5713 times |
Mon 31 March 2025 |
41.51 (-2.33%) |
42.36 |
41.10 - 43.18 |
1.1245 times |
Fri 28 February 2025 |
42.50 (0.83%) |
42.34 |
41.89 - 43.59 |
0.8868 times |
DMA SMA EMA moving averages of Source Capital SOR
DMA (daily moving average) of Source Capital SOR
| DMA period | DMA value | | 5 day DMA | 48.07 | | 12 day DMA | 47.38 | | 20 day DMA | 46.63 | | 35 day DMA | 46.13 | | 50 day DMA | 45.88 | | 100 day DMA | 45.06 | | 150 day DMA | 44.31 | | 200 day DMA | 43.56 | EMA (exponential moving average) of Source Capital SOR
| EMA period | EMA current | EMA prev | EMA prev2 | | 5 day EMA | 47.7 | 48.03 | 48.29 | | 12 day EMA | 47.39 | 47.45 | 47.44 | | 20 day EMA | 46.94 | 46.93 | 46.87 | | 35 day EMA | 46.46 | 46.43 | 46.37 | | 50 day EMA | 46.02 | 45.98 | 45.92 |
SMA (simple moving average) of Source Capital SOR
| SMA period | SMA current | SMA prev | SMA prev2 | | 5 day SMA | 48.07 | 48.42 | 48.46 | | 12 day SMA | 47.38 | 47.26 | 47.06 | | 20 day SMA | 46.63 | 46.57 | 46.46 | | 35 day SMA | 46.13 | 46.09 | 46.02 | | 50 day SMA | 45.88 | 45.84 | 45.79 | | 100 day SMA | 45.06 | 45.03 | 45 | | 150 day SMA | 44.31 | 44.27 | 44.23 | | 200 day SMA | 43.56 | 43.54 | 43.52 |
|
|
