SouthernCompany SOJE full analysis,charts,indicators,moving averages,SMA,DMA,EMA,ADX,MACD,RSISouthern Company SOJE WideScreen charts, DMA,SMA,EMA technical analysis, forecast prediction, by indicators ADX,MACD,RSI,CCI NYSE stock exchange
Daily price and charts and targets SouthernCompany Strong Daily Stock price targets for SouthernCompany SOJE are 17.73 and 17.88 | Daily Target 1 | 17.7 | | Daily Target 2 | 17.76 | | Daily Target 3 | 17.85 | | Daily Target 4 | 17.91 | | Daily Target 5 | 18 |
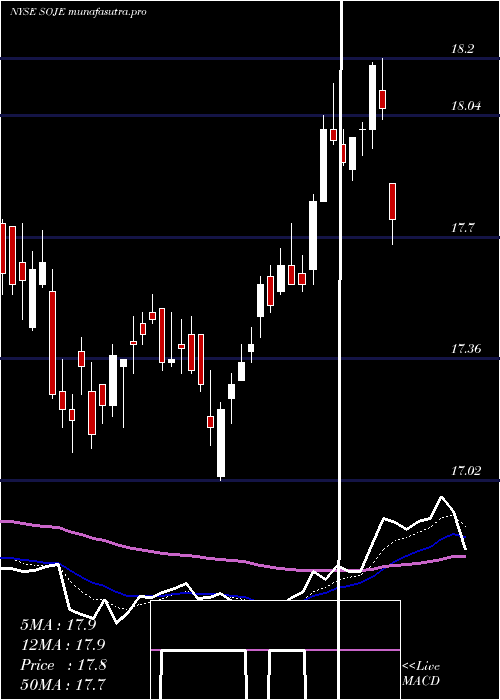
Daily price and volume Southern Company
| Date |
Closing |
Open |
Range |
Volume |
Thu 04 December 2025 |
17.82 (-0.28%) |
17.83 |
17.79 - 17.94 |
0.5424 times |
Wed 03 December 2025 |
17.87 (0%) |
17.78 |
17.78 - 17.90 |
1.1111 times |
Tue 02 December 2025 |
17.87 (0.11%) |
17.81 |
17.75 - 17.90 |
1.1374 times |
Mon 01 December 2025 |
17.85 (-0.17%) |
17.79 |
17.79 - 17.88 |
2.5123 times |
Fri 28 November 2025 |
17.88 (-0.06%) |
17.89 |
17.84 - 17.93 |
1.4103 times |
Wed 26 November 2025 |
17.89 (0.22%) |
17.84 |
17.83 - 17.93 |
0.4305 times |
Tue 25 November 2025 |
17.85 (0.56%) |
17.85 |
17.75 - 18.00 |
0.6406 times |
Mon 24 November 2025 |
17.75 (0.11%) |
17.74 |
17.72 - 17.85 |
0.2878 times |
Fri 21 November 2025 |
17.73 (0.4%) |
17.66 |
17.62 - 17.83 |
0.8222 times |
Thu 20 November 2025 |
17.66 (-1.06%) |
17.90 |
17.62 - 17.94 |
1.1054 times |
Wed 19 November 2025 |
17.85 (-0.34%) |
17.92 |
17.84 - 17.92 |
0.6361 times |
Weekly price and charts SouthernCompany Strong weekly Stock price targets for SouthernCompany SOJE are 17.79 and 17.98 | Weekly Target 1 | 17.65 | | Weekly Target 2 | 17.73 | | Weekly Target 3 | 17.836666666667 | | Weekly Target 4 | 17.92 | | Weekly Target 5 | 18.03 |
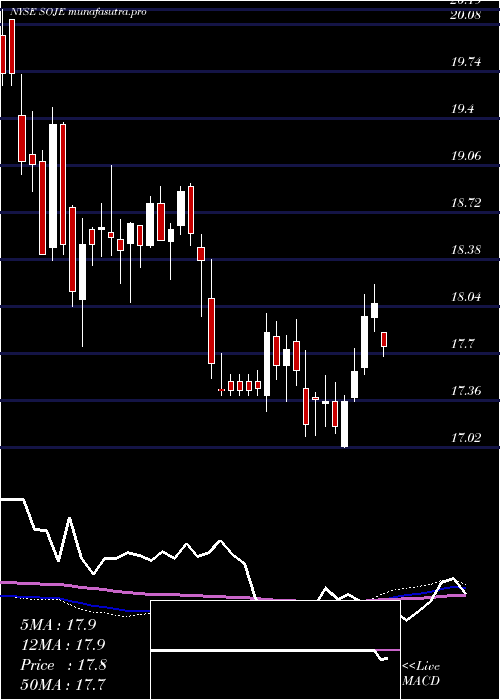
Weekly price and volumes for Southern Company
| Date |
Closing |
Open |
Range |
Volume |
Thu 04 December 2025 |
17.82 (-0.34%) |
17.79 |
17.75 - 17.94 |
1.6393 times |
Fri 28 November 2025 |
17.88 (0.85%) |
17.74 |
17.72 - 18.00 |
0.856 times |
Fri 21 November 2025 |
17.73 (-2.26%) |
18.14 |
17.62 - 18.17 |
1.2253 times |
Fri 14 November 2025 |
18.14 (-1.63%) |
18.41 |
18.12 - 18.60 |
1.0565 times |
Fri 07 November 2025 |
18.44 (-0.38%) |
18.40 |
18.28 - 18.61 |
1.2016 times |
Fri 31 October 2025 |
18.51 (0%) |
18.48 |
18.44 - 18.62 |
0.3202 times |
Fri 31 October 2025 |
18.51 (-0.8%) |
18.74 |
18.44 - 18.79 |
0.9153 times |
Fri 24 October 2025 |
18.66 (0.59%) |
18.57 |
18.50 - 18.81 |
1.1045 times |
Fri 17 October 2025 |
18.55 (0.65%) |
18.56 |
18.17 - 18.60 |
1.1282 times |
Fri 10 October 2025 |
18.43 (-2.18%) |
18.76 |
18.38 - 18.87 |
0.553 times |
Fri 03 October 2025 |
18.84 (0.64%) |
18.73 |
18.47 - 19.11 |
1.1539 times |
Monthly price and charts SouthernCompany Strong monthly Stock price targets for SouthernCompany SOJE are 17.79 and 17.98 | Monthly Target 1 | 17.65 | | Monthly Target 2 | 17.73 | | Monthly Target 3 | 17.836666666667 | | Monthly Target 4 | 17.92 | | Monthly Target 5 | 18.03 |
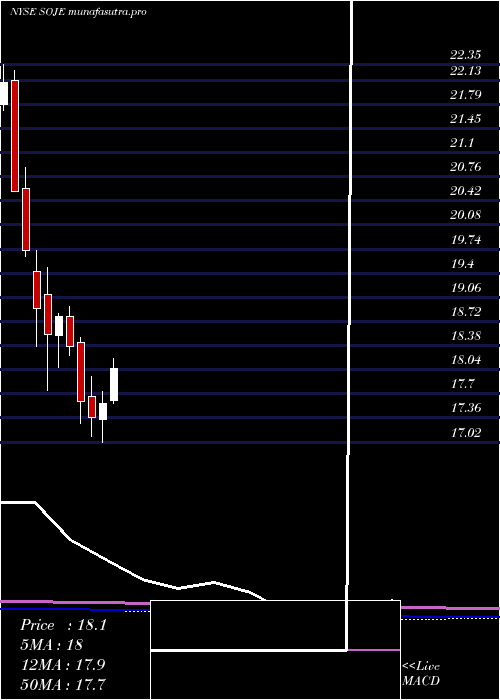
Monthly price and volumes Southern Company
| Date |
Closing |
Open |
Range |
Volume |
Thu 04 December 2025 |
17.82 (-0.34%) |
17.79 |
17.75 - 17.94 |
0.391 times |
Fri 28 November 2025 |
17.88 (-3.4%) |
18.40 |
17.62 - 18.61 |
1.0349 times |
Fri 31 October 2025 |
18.51 (-0.16%) |
18.61 |
18.17 - 19.11 |
1.0625 times |
Tue 30 September 2025 |
18.54 (1.87%) |
18.19 |
18.13 - 19.74 |
0.7609 times |
Fri 29 August 2025 |
18.20 (0.83%) |
18.05 |
17.85 - 18.80 |
0.971 times |
Thu 31 July 2025 |
18.05 (2.73%) |
17.61 |
17.38 - 18.20 |
0.9804 times |
Mon 30 June 2025 |
17.57 (1.15%) |
17.34 |
17.02 - 17.74 |
0.9168 times |
Fri 30 May 2025 |
17.37 (-1.31%) |
17.66 |
17.10 - 17.95 |
1.0373 times |
Wed 30 April 2025 |
17.60 (-4.19%) |
18.43 |
17.28 - 18.49 |
0.8593 times |
Mon 31 March 2025 |
18.37 (-2.24%) |
18.79 |
18.24 - 18.93 |
1.986 times |
Fri 28 February 2025 |
18.79 (1.35%) |
18.53 |
18.07 - 18.84 |
0.8795 times |
DMA SMA EMA moving averages of Southern Company SOJE
DMA (daily moving average) of Southern Company SOJE
| DMA period | DMA value | | 5 day DMA | 17.86 | | 12 day DMA | 17.83 | | 20 day DMA | 18.03 | | 35 day DMA | 18.27 | | 50 day DMA | 18.4 | | 100 day DMA | 18.43 | | 150 day DMA | 18.13 | | 200 day DMA | 18.16 | EMA (exponential moving average) of Southern Company SOJE
| EMA period | EMA current | EMA prev | EMA prev2 | | 5 day EMA | 17.85 | 17.86 | 17.86 | | 12 day EMA | 17.9 | 17.92 | 17.93 | | 20 day EMA | 18.03 | 18.05 | 18.07 | | 35 day EMA | 18.21 | 18.23 | 18.25 | | 50 day EMA | 18.43 | 18.45 | 18.47 |
SMA (simple moving average) of Southern Company SOJE
| SMA period | SMA current | SMA prev | SMA prev2 | | 5 day SMA | 17.86 | 17.87 | 17.87 | | 12 day SMA | 17.83 | 17.84 | 17.86 | | 20 day SMA | 18.03 | 18.07 | 18.1 | | 35 day SMA | 18.27 | 18.29 | 18.3 | | 50 day SMA | 18.4 | 18.43 | 18.45 | | 100 day SMA | 18.43 | 18.42 | 18.42 | | 150 day SMA | 18.13 | 18.13 | 18.13 | | 200 day SMA | 18.16 | 18.16 | 18.17 |
|
|
