SouthernCompany SOJD full analysis,charts,indicators,moving averages,SMA,DMA,EMA,ADX,MACD,RSISouthern Company SOJD WideScreen charts, DMA,SMA,EMA technical analysis, forecast prediction, by indicators ADX,MACD,RSI,CCI NYSE stock exchange
Daily price and charts and targets SouthernCompany Strong Daily Stock price targets for SouthernCompany SOJD are 19.94 and 20.12 | Daily Target 1 | 19.82 | | Daily Target 2 | 19.93 | | Daily Target 3 | 20.003333333333 | | Daily Target 4 | 20.11 | | Daily Target 5 | 20.18 |
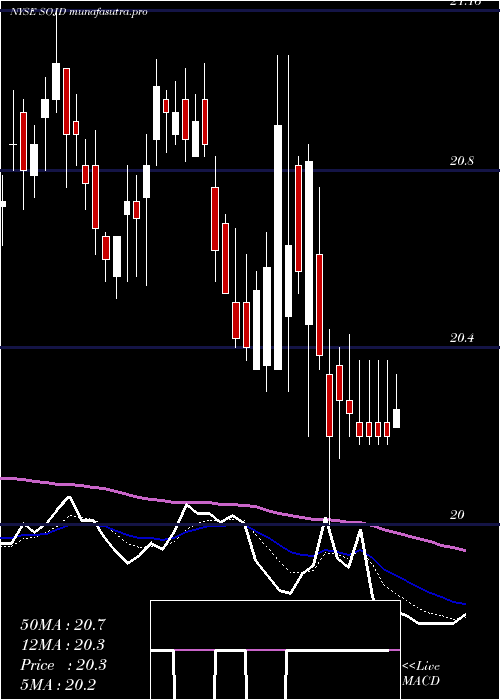
Daily price and volume Southern Company
| Date |
Closing |
Open |
Range |
Volume |
Fri 05 December 2025 |
20.03 (-0.05%) |
20.03 |
19.90 - 20.08 |
1.6437 times |
Thu 04 December 2025 |
20.04 (-0.35%) |
20.10 |
20.03 - 20.15 |
1.0143 times |
Wed 03 December 2025 |
20.11 (0%) |
20.11 |
20.03 - 20.14 |
0.7877 times |
Tue 02 December 2025 |
20.11 (0.4%) |
20.01 |
19.92 - 20.11 |
1.3084 times |
Mon 01 December 2025 |
20.03 (-0.5%) |
20.02 |
19.97 - 20.13 |
0.797 times |
Fri 28 November 2025 |
20.13 (-0.35%) |
20.21 |
20.05 - 20.24 |
1.3665 times |
Wed 26 November 2025 |
20.20 (0.35%) |
20.15 |
20.11 - 20.24 |
0.7708 times |
Tue 25 November 2025 |
20.13 (0.25%) |
20.10 |
20.07 - 20.25 |
0.8926 times |
Mon 24 November 2025 |
20.08 (0.3%) |
20.06 |
20.03 - 20.18 |
0.5901 times |
Fri 21 November 2025 |
20.02 (0.2%) |
19.98 |
19.91 - 20.15 |
0.8289 times |
Thu 20 November 2025 |
19.98 (-0.4%) |
20.14 |
19.92 - 20.20 |
1.211 times |
Weekly price and charts SouthernCompany Strong weekly Stock price targets for SouthernCompany SOJD are 19.97 and 20.22 | Weekly Target 1 | 19.78 | | Weekly Target 2 | 19.9 | | Weekly Target 3 | 20.026666666667 | | Weekly Target 4 | 20.15 | | Weekly Target 5 | 20.28 |
Weekly price and volumes for Southern Company
| Date |
Closing |
Open |
Range |
Volume |
Fri 05 December 2025 |
20.03 (-0.5%) |
20.02 |
19.90 - 20.15 |
1.0843 times |
Fri 28 November 2025 |
20.13 (0.55%) |
20.06 |
20.03 - 20.25 |
0.7071 times |
Fri 21 November 2025 |
20.02 (-1.33%) |
20.27 |
19.90 - 20.29 |
1.0294 times |
Fri 14 November 2025 |
20.29 (-1.84%) |
20.69 |
20.14 - 20.83 |
0.7261 times |
Fri 07 November 2025 |
20.67 (-0.39%) |
20.62 |
20.53 - 20.76 |
0.6805 times |
Fri 31 October 2025 |
20.75 (0%) |
20.86 |
20.68 - 20.86 |
0.3979 times |
Fri 31 October 2025 |
20.75 (-1.98%) |
21.22 |
20.68 - 21.28 |
1.0861 times |
Fri 24 October 2025 |
21.17 (0.38%) |
21.11 |
21.05 - 21.36 |
0.6368 times |
Fri 17 October 2025 |
21.09 (1.54%) |
20.91 |
20.81 - 21.09 |
2.9982 times |
Fri 10 October 2025 |
20.77 (-2.21%) |
21.18 |
20.76 - 21.25 |
0.6535 times |
Fri 03 October 2025 |
21.24 (0.47%) |
21.16 |
20.87 - 21.47 |
1.1703 times |

Monthly price and charts SouthernCompany Strong monthly Stock price targets for SouthernCompany SOJD are 19.97 and 20.22 | Monthly Target 1 | 19.78 | | Monthly Target 2 | 19.9 | | Monthly Target 3 | 20.026666666667 | | Monthly Target 4 | 20.15 | | Monthly Target 5 | 20.28 |
Monthly price and volumes Southern Company
| Date |
Closing |
Open |
Range |
Volume |
Fri 05 December 2025 |
20.03 (-0.5%) |
20.02 |
19.90 - 20.15 |
0.3101 times |
Fri 28 November 2025 |
20.13 (-2.99%) |
20.62 |
19.90 - 20.83 |
0.8989 times |
Fri 31 October 2025 |
20.75 (-1.1%) |
21.05 |
20.68 - 21.47 |
1.7906 times |
Tue 30 September 2025 |
20.98 (-2.51%) |
21.43 |
20.87 - 22.40 |
0.9939 times |
Fri 29 August 2025 |
21.52 (4.26%) |
20.69 |
20.41 - 21.66 |
1.1024 times |
Thu 31 July 2025 |
20.64 (4.24%) |
19.84 |
19.83 - 20.64 |
0.8241 times |
Mon 30 June 2025 |
19.80 (-0.25%) |
19.87 |
19.57 - 20.07 |
0.9375 times |
Fri 30 May 2025 |
19.85 (-1%) |
20.11 |
19.26 - 20.27 |
1.0545 times |
Wed 30 April 2025 |
20.05 (-1.81%) |
20.50 |
20.00 - 21.06 |
1.0697 times |
Mon 31 March 2025 |
20.42 (-2.58%) |
20.96 |
20.40 - 21.16 |
1.0181 times |
Fri 28 February 2025 |
20.96 (0.96%) |
20.72 |
20.27 - 21.01 |
1.0311 times |

DMA SMA EMA moving averages of Southern Company SOJD
DMA (daily moving average) of Southern Company SOJD
| DMA period | DMA value | | 5 day DMA | 20.06 | | 12 day DMA | 20.08 | | 20 day DMA | 20.22 | | 35 day DMA | 20.55 | | 50 day DMA | 20.71 | | 100 day DMA | 20.98 | | 150 day DMA | 20.64 | | 200 day DMA | 20.63 | EMA (exponential moving average) of Southern Company SOJD
| EMA period | EMA current | EMA prev | EMA prev2 | | 5 day EMA | 20.06 | 20.08 | 20.1 | | 12 day EMA | 20.13 | 20.15 | 20.17 | | 20 day EMA | 20.26 | 20.28 | 20.3 | | 35 day EMA | 20.46 | 20.49 | 20.52 | | 50 day EMA | 20.73 | 20.76 | 20.79 |
SMA (simple moving average) of Southern Company SOJD
| SMA period | SMA current | SMA prev | SMA prev2 | | 5 day SMA | 20.06 | 20.08 | 20.12 | | 12 day SMA | 20.08 | 20.08 | 20.09 | | 20 day SMA | 20.22 | 20.26 | 20.29 | | 35 day SMA | 20.55 | 20.57 | 20.6 | | 50 day SMA | 20.71 | 20.73 | 20.77 | | 100 day SMA | 20.98 | 20.98 | 20.98 | | 150 day SMA | 20.64 | 20.64 | 20.64 | | 200 day SMA | 20.63 | 20.63 | 20.63 |
|
|
