SouthernCompany SO full analysis,charts,indicators,moving averages,SMA,DMA,EMA,ADX,MACD,RSISouthern Company SO WideScreen charts, DMA,SMA,EMA technical analysis, forecast prediction, by indicators ADX,MACD,RSI,CCI NYSE stock exchange
operates under Public Utilities sector & deals in Electric Utilities Central
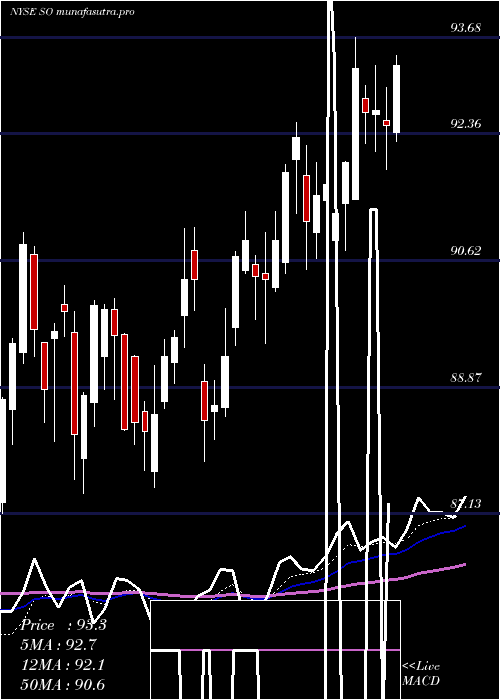
Daily price and charts and targets SouthernCompany Strong Daily Stock price targets for SouthernCompany SO are 96.98 and 98.05 | Daily Target 1 | 96.74 | | Daily Target 2 | 97.22 | | Daily Target 3 | 97.813333333333 | | Daily Target 4 | 98.29 | | Daily Target 5 | 98.88 |
Daily price and volume Southern Company
| Date |
Closing |
Open |
Range |
Volume |
Mon 20 October 2025 |
97.69 (-0.11%) |
98.40 |
97.34 - 98.41 |
1.0274 times |
Fri 17 October 2025 |
97.80 (-0.23%) |
99.12 |
97.61 - 99.15 |
1.0012 times |
Thu 16 October 2025 |
98.03 (-1.69%) |
99.75 |
97.50 - 100.84 |
0.7194 times |
Wed 15 October 2025 |
99.72 (0.04%) |
99.60 |
99.17 - 100.24 |
1.484 times |
Tue 14 October 2025 |
99.68 (1.63%) |
98.70 |
98.46 - 99.81 |
1.0881 times |
Mon 13 October 2025 |
98.08 (-0.21%) |
97.62 |
97.19 - 98.42 |
0.868 times |
Fri 10 October 2025 |
98.29 (2.25%) |
96.66 |
96.45 - 98.36 |
1.0786 times |
Thu 09 October 2025 |
96.13 (-0.05%) |
96.66 |
96.01 - 96.66 |
0.8378 times |
Wed 08 October 2025 |
96.18 (-0.25%) |
96.79 |
95.50 - 96.79 |
0.7536 times |
Tue 07 October 2025 |
96.42 (0.97%) |
95.49 |
95.30 - 96.77 |
1.142 times |
Mon 06 October 2025 |
95.49 (1%) |
94.55 |
93.00 - 95.53 |
0.7543 times |
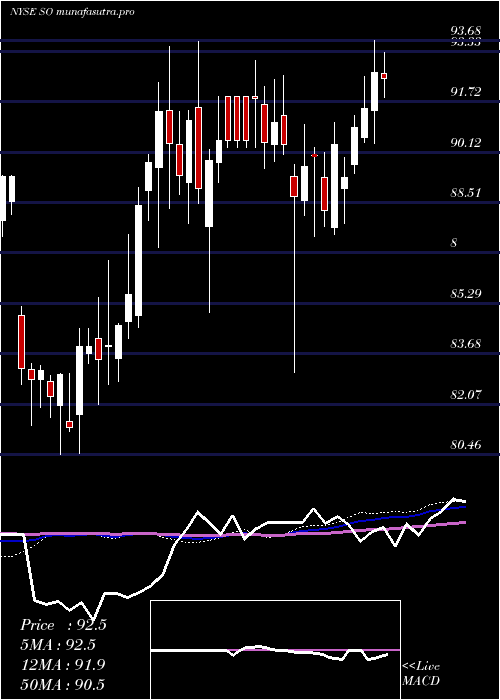
Weekly price and charts SouthernCompany Strong weekly Stock price targets for SouthernCompany SO are 96.98 and 98.05 | Weekly Target 1 | 96.74 | | Weekly Target 2 | 97.22 | | Weekly Target 3 | 97.813333333333 | | Weekly Target 4 | 98.29 | | Weekly Target 5 | 98.88 |
Weekly price and volumes for Southern Company
| Date |
Closing |
Open |
Range |
Volume |
Mon 20 October 2025 |
97.69 (-0.11%) |
98.40 |
97.34 - 98.41 |
0.2638 times |
Fri 17 October 2025 |
97.80 (-0.5%) |
97.62 |
97.19 - 100.84 |
1.3251 times |
Fri 10 October 2025 |
98.29 (3.97%) |
94.55 |
93.00 - 98.36 |
1.1725 times |
Fri 03 October 2025 |
94.54 (0.01%) |
94.50 |
93.45 - 95.38 |
1.5429 times |
Fri 26 September 2025 |
94.53 (2.97%) |
91.88 |
91.63 - 95.06 |
1.4109 times |
Fri 19 September 2025 |
91.80 (-0.51%) |
92.01 |
90.35 - 92.40 |
1.6246 times |
Fri 12 September 2025 |
92.27 (0.53%) |
91.43 |
90.53 - 92.43 |
0.9772 times |
Fri 05 September 2025 |
91.78 (-0.56%) |
92.24 |
91.17 - 92.82 |
0.7103 times |
Fri 29 August 2025 |
92.30 (0%) |
92.47 |
92.22 - 92.81 |
0.1688 times |
Fri 29 August 2025 |
92.30 (-2.31%) |
94.23 |
92.07 - 94.49 |
0.8039 times |
Fri 22 August 2025 |
94.48 (0.44%) |
93.58 |
92.77 - 95.64 |
1.1461 times |
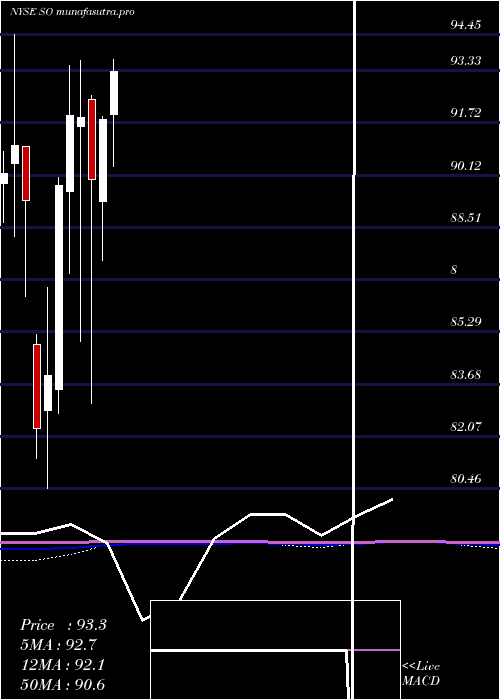
Monthly price and charts SouthernCompany Strong monthly Stock price targets for SouthernCompany SO are 95.35 and 103.19 | Monthly Target 1 | 89.34 | | Monthly Target 2 | 93.51 | | Monthly Target 3 | 97.176666666667 | | Monthly Target 4 | 101.35 | | Monthly Target 5 | 105.02 |
Monthly price and volumes Southern Company
| Date |
Closing |
Open |
Range |
Volume |
Mon 20 October 2025 |
97.69 (3.08%) |
94.92 |
93.00 - 100.84 |
0.6623 times |
Tue 30 September 2025 |
94.77 (2.68%) |
92.24 |
90.35 - 95.06 |
1.0485 times |
Fri 29 August 2025 |
92.30 (-2.31%) |
95.24 |
92.07 - 96.42 |
0.9382 times |
Thu 31 July 2025 |
94.48 (2.89%) |
92.00 |
90.38 - 96.44 |
1.1493 times |
Mon 30 June 2025 |
91.83 (2.03%) |
89.30 |
87.49 - 91.94 |
1.0302 times |
Fri 30 May 2025 |
90.00 (-2.06%) |
92.44 |
83.09 - 92.56 |
1.1456 times |
Wed 30 April 2025 |
91.89 (-0.07%) |
91.60 |
85.00 - 93.65 |
0.9256 times |
Mon 31 March 2025 |
91.95 (2.41%) |
89.61 |
87.09 - 93.48 |
0.9753 times |
Fri 28 February 2025 |
89.79 (6.96%) |
83.52 |
82.78 - 90.03 |
0.9523 times |
Fri 31 January 2025 |
83.95 (1.98%) |
82.87 |
80.46 - 86.65 |
1.1726 times |
Tue 31 December 2024 |
82.32 (-7.85%) |
84.90 |
81.38 - 85.20 |
0.5803 times |
DMA SMA EMA moving averages of Southern Company SO
DMA (daily moving average) of Southern Company SO
| DMA period | DMA value | | 5 day DMA | 98.58 | | 12 day DMA | 97.34 | | 20 day DMA | 96.09 | | 35 day DMA | 94.23 | | 50 day DMA | 94.05 | | 100 day DMA | 92.99 | | 150 day DMA | 91.99 | | 200 day DMA | 90.48 | EMA (exponential moving average) of Southern Company SO
| EMA period | EMA current | EMA prev | EMA prev2 | | 5 day EMA | 98.02 | 98.18 | 98.37 | | 12 day EMA | 97.28 | 97.21 | 97.1 | | 20 day EMA | 96.38 | 96.24 | 96.08 | | 35 day EMA | 95.48 | 95.35 | 95.21 | | 50 day EMA | 94.55 | 94.42 | 94.28 |
SMA (simple moving average) of Southern Company SO
| SMA period | SMA current | SMA prev | SMA prev2 | | 5 day SMA | 98.58 | 98.66 | 98.76 | | 12 day SMA | 97.34 | 97.02 | 96.77 | | 20 day SMA | 96.09 | 95.82 | 95.52 | | 35 day SMA | 94.23 | 94.08 | 93.92 | | 50 day SMA | 94.05 | 93.99 | 93.92 | | 100 day SMA | 92.99 | 92.91 | 92.83 | | 150 day SMA | 91.99 | 91.94 | 91.89 | | 200 day SMA | 90.48 | 90.41 | 90.33 |
|
|
