SchneiderNational SNDR full analysis,charts,indicators,moving averages,SMA,DMA,EMA,ADX,MACD,RSISchneider National SNDR WideScreen charts, DMA,SMA,EMA technical analysis, forecast prediction, by indicators ADX,MACD,RSI,CCI NYSE stock exchange
operates under Transportation sector & deals in Trucking Freight Courier Services
Daily price and charts and targets SchneiderNational Strong Daily Stock price targets for SchneiderNational SNDR are 25.54 and 26.38 | Daily Target 1 | 24.84 | | Daily Target 2 | 25.4 | | Daily Target 3 | 25.683333333333 | | Daily Target 4 | 26.24 | | Daily Target 5 | 26.52 |
Daily price and volume Schneider National
| Date |
Closing |
Open |
Range |
Volume |
Fri 05 December 2025 |
25.95 (2.45%) |
25.35 |
25.13 - 25.97 |
0.9191 times |
Thu 04 December 2025 |
25.33 (0.64%) |
25.11 |
25.08 - 25.58 |
1.133 times |
Wed 03 December 2025 |
25.17 (7.38%) |
23.98 |
23.86 - 25.36 |
1.8424 times |
Tue 02 December 2025 |
23.44 (2.14%) |
22.91 |
22.66 - 23.59 |
1.0206 times |
Mon 01 December 2025 |
22.95 (1.5%) |
22.38 |
22.31 - 23.18 |
0.976 times |
Fri 28 November 2025 |
22.61 (0.36%) |
22.69 |
22.45 - 22.71 |
0.3116 times |
Wed 26 November 2025 |
22.53 (0.4%) |
22.35 |
22.35 - 22.83 |
0.9732 times |
Tue 25 November 2025 |
22.44 (3.84%) |
21.76 |
21.52 - 22.55 |
0.8889 times |
Mon 24 November 2025 |
21.61 (-0.18%) |
21.64 |
21.46 - 21.84 |
1.0944 times |
Fri 21 November 2025 |
21.65 (5%) |
20.72 |
20.69 - 21.79 |
0.8407 times |
Thu 20 November 2025 |
20.62 (-0.72%) |
20.94 |
20.59 - 21.31 |
0.6901 times |
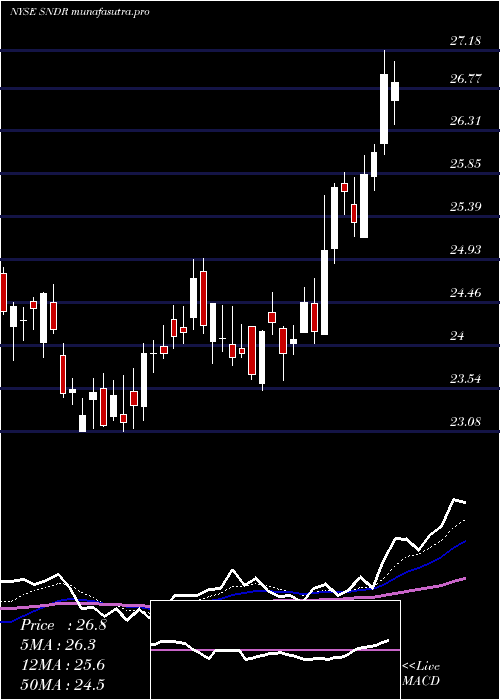
Weekly price and charts SchneiderNational Strong weekly Stock price targets for SchneiderNational SNDR are 24.13 and 27.79 | Weekly Target 1 | 21.08 | | Weekly Target 2 | 23.52 | | Weekly Target 3 | 24.743333333333 | | Weekly Target 4 | 27.18 | | Weekly Target 5 | 28.4 |
Weekly price and volumes for Schneider National
| Date |
Closing |
Open |
Range |
Volume |
Fri 05 December 2025 |
25.95 (14.77%) |
22.38 |
22.31 - 25.97 |
1.4629 times |
Fri 28 November 2025 |
22.61 (4.43%) |
21.64 |
21.46 - 22.83 |
0.8115 times |
Fri 21 November 2025 |
21.65 (0.93%) |
21.48 |
20.51 - 21.79 |
0.8917 times |
Fri 14 November 2025 |
21.45 (-5.71%) |
22.77 |
21.34 - 22.81 |
0.939 times |
Fri 07 November 2025 |
22.75 (6.46%) |
21.32 |
21.25 - 22.78 |
1.0613 times |
Fri 31 October 2025 |
21.37 (0%) |
20.18 |
20.11 - 21.48 |
0.4955 times |
Fri 31 October 2025 |
21.37 (-6.64%) |
22.91 |
20.11 - 23.17 |
1.4692 times |
Fri 24 October 2025 |
22.89 (-1.42%) |
23.31 |
22.33 - 24.11 |
1.0346 times |
Fri 17 October 2025 |
23.22 (7.45%) |
22.23 |
21.87 - 23.97 |
1.249 times |
Tue 07 October 2025 |
21.61 (-0.55%) |
21.98 |
21.35 - 22.32 |
0.5852 times |
Fri 03 October 2025 |
21.73 (2.21%) |
21.36 |
20.70 - 22.09 |
1.474 times |
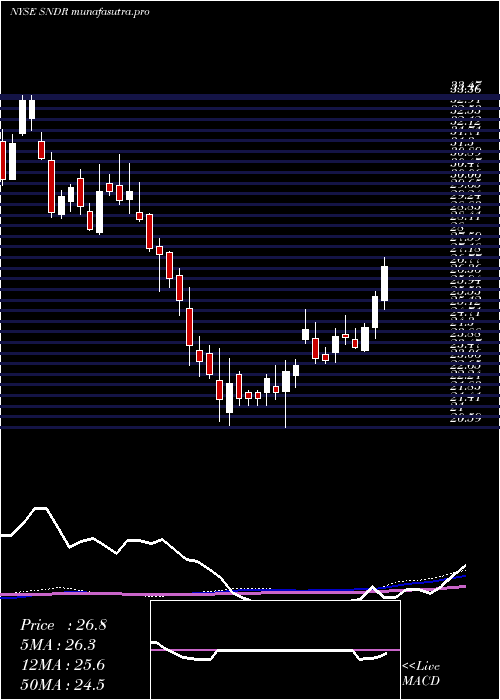
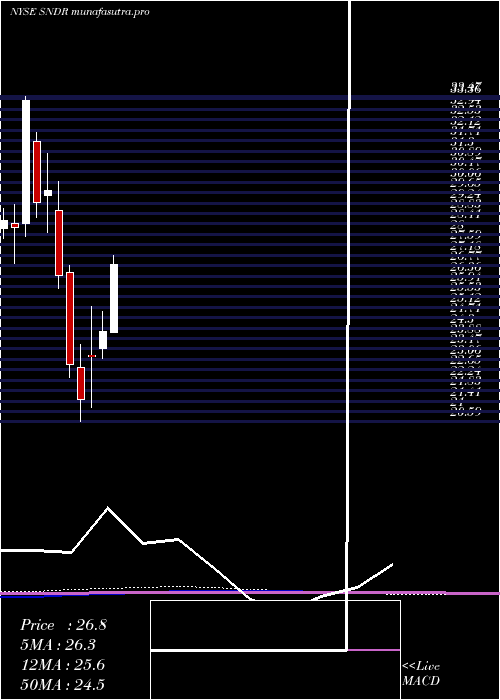
Monthly price and charts SchneiderNational Strong monthly Stock price targets for SchneiderNational SNDR are 24.13 and 27.79 | Monthly Target 1 | 21.08 | | Monthly Target 2 | 23.52 | | Monthly Target 3 | 24.743333333333 | | Monthly Target 4 | 27.18 | | Monthly Target 5 | 28.4 |
Monthly price and volumes Schneider National
| Date |
Closing |
Open |
Range |
Volume |
Fri 05 December 2025 |
25.95 (14.77%) |
22.38 |
22.31 - 25.97 |
0.3862 times |
Fri 28 November 2025 |
22.61 (5.8%) |
21.32 |
20.51 - 22.83 |
0.9776 times |
Fri 31 October 2025 |
21.37 (0.99%) |
20.99 |
20.11 - 24.11 |
1.4941 times |
Tue 30 September 2025 |
21.16 (-14.4%) |
24.43 |
20.70 - 25.16 |
1.1642 times |
Fri 29 August 2025 |
24.72 (1.1%) |
24.45 |
23.44 - 25.75 |
1.0009 times |
Thu 31 July 2025 |
24.45 (1.24%) |
24.12 |
24.02 - 27.18 |
1.0784 times |
Mon 30 June 2025 |
24.15 (4.23%) |
23.51 |
23.11 - 24.94 |
0.8681 times |
Fri 30 May 2025 |
23.17 (7.82%) |
23.20 |
21.15 - 25.17 |
1.0179 times |
Wed 30 April 2025 |
21.49 (-5.95%) |
22.73 |
20.59 - 23.66 |
0.9924 times |
Mon 31 March 2025 |
22.85 (-13.38%) |
26.49 |
22.36 - 26.77 |
1.0203 times |
Fri 28 February 2025 |
26.38 (-11.33%) |
28.94 |
25.88 - 30.09 |
0.8382 times |
DMA SMA EMA moving averages of Schneider National SNDR
DMA (daily moving average) of Schneider National SNDR
| DMA period | DMA value | | 5 day DMA | 24.57 | | 12 day DMA | 22.92 | | 20 day DMA | 22.46 | | 35 day DMA | 22.48 | | 50 day DMA | 22.27 | | 100 day DMA | 23.43 | | 150 day DMA | 23.62 | | 200 day DMA | 23.68 | EMA (exponential moving average) of Schneider National SNDR
| EMA period | EMA current | EMA prev | EMA prev2 | | 5 day EMA | 24.76 | 24.16 | 23.57 | | 12 day EMA | 23.56 | 23.12 | 22.72 | | 20 day EMA | 23.01 | 22.7 | 22.42 | | 35 day EMA | 22.64 | 22.45 | 22.28 | | 50 day EMA | 22.57 | 22.43 | 22.31 |
SMA (simple moving average) of Schneider National SNDR
| SMA period | SMA current | SMA prev | SMA prev2 | | 5 day SMA | 24.57 | 23.9 | 23.34 | | 12 day SMA | 22.92 | 22.51 | 22.13 | | 20 day SMA | 22.46 | 22.27 | 22.12 | | 35 day SMA | 22.48 | 22.41 | 22.34 | | 50 day SMA | 22.27 | 22.19 | 22.13 | | 100 day SMA | 23.43 | 23.44 | 23.46 | | 150 day SMA | 23.62 | 23.6 | 23.57 | | 200 day SMA | 23.68 | 23.69 | 23.7 |
|
|
