SnapOn SNA full analysis,charts,indicators,moving averages,SMA,DMA,EMA,ADX,MACD,RSISnap On SNA WideScreen charts, DMA,SMA,EMA technical analysis, forecast prediction, by indicators ADX,MACD,RSI,CCI NYSE stock exchange
operates under Capital Goods sector & deals in Industrial Machinery Components
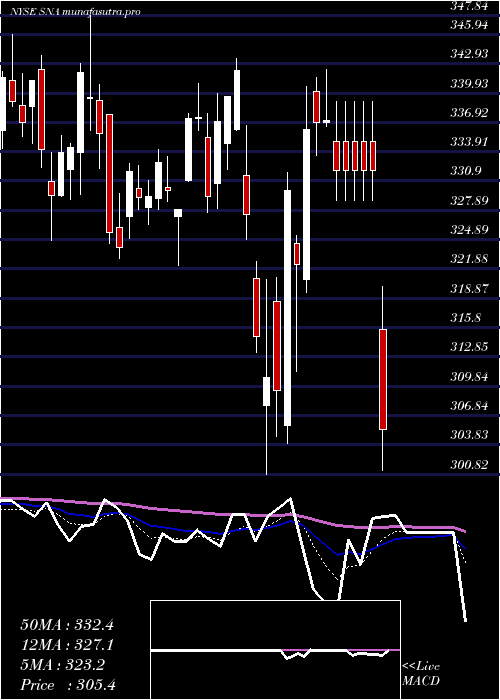
Daily price and charts and targets SnapOn Strong Daily Stock price targets for SnapOn SNA are 338.44 and 345.29 | Daily Target 1 | 333.06 | | Daily Target 2 | 336.97 | | Daily Target 3 | 339.91333333333 | | Daily Target 4 | 343.82 | | Daily Target 5 | 346.76 |
Daily price and volume Snap On
| Date |
Closing |
Open |
Range |
Volume |
Mon 20 October 2025 |
340.87 (0.33%) |
340.68 |
336.01 - 342.86 |
0.7159 times |
Fri 17 October 2025 |
339.75 (-1.28%) |
344.07 |
337.10 - 344.61 |
1.1905 times |
Thu 16 October 2025 |
344.17 (3.48%) |
346.00 |
337.52 - 357.41 |
2.2872 times |
Wed 15 October 2025 |
332.59 (-1.31%) |
337.80 |
328.00 - 337.90 |
1.0213 times |
Tue 14 October 2025 |
337.02 (1.52%) |
328.98 |
328.98 - 337.87 |
0.8631 times |
Mon 13 October 2025 |
331.99 (1.42%) |
331.00 |
329.59 - 334.80 |
1.1004 times |
Fri 10 October 2025 |
327.33 (-1.34%) |
333.05 |
326.45 - 333.83 |
0.719 times |
Thu 09 October 2025 |
331.79 (-2.2%) |
340.21 |
331.77 - 341.18 |
0.5669 times |
Wed 08 October 2025 |
339.25 (0.72%) |
337.87 |
336.73 - 340.74 |
0.7822 times |
Tue 07 October 2025 |
336.84 (-1.09%) |
342.06 |
334.85 - 342.06 |
0.7535 times |
Mon 06 October 2025 |
340.56 (-1.97%) |
348.82 |
340.56 - 348.82 |
0.4138 times |
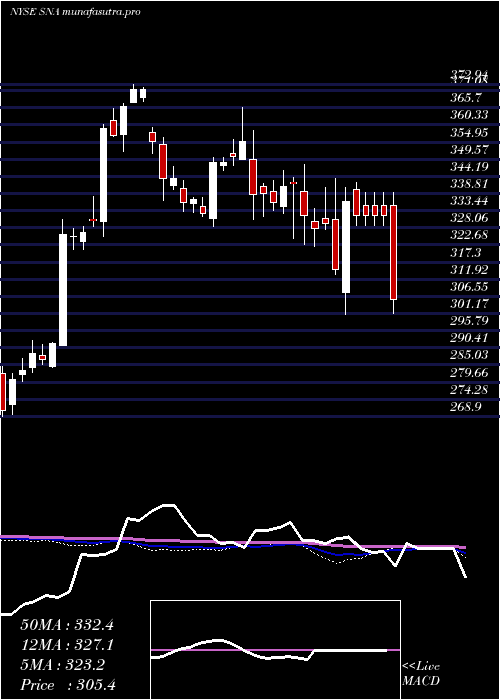
Weekly price and charts SnapOn Strong weekly Stock price targets for SnapOn SNA are 338.44 and 345.29 | Weekly Target 1 | 333.06 | | Weekly Target 2 | 336.97 | | Weekly Target 3 | 339.91333333333 | | Weekly Target 4 | 343.82 | | Weekly Target 5 | 346.76 |
Weekly price and volumes for Snap On
| Date |
Closing |
Open |
Range |
Volume |
Mon 20 October 2025 |
340.87 (0.33%) |
340.68 |
336.01 - 342.86 |
0.2562 times |
Fri 17 October 2025 |
339.75 (3.79%) |
331.00 |
328.00 - 357.41 |
2.3128 times |
Fri 10 October 2025 |
327.33 (-5.78%) |
348.82 |
326.45 - 348.82 |
1.1579 times |
Fri 03 October 2025 |
347.42 (1.61%) |
344.17 |
340.84 - 350.30 |
1.0716 times |
Fri 26 September 2025 |
341.91 (1.38%) |
334.48 |
333.78 - 342.13 |
0.9695 times |
Fri 19 September 2025 |
337.24 (1.09%) |
336.00 |
330.58 - 341.98 |
1.8725 times |
Fri 12 September 2025 |
333.59 (1.49%) |
328.70 |
321.68 - 334.87 |
0.8732 times |
Fri 05 September 2025 |
328.70 (1.06%) |
323.02 |
319.20 - 331.48 |
0.6323 times |
Fri 29 August 2025 |
325.24 (0%) |
327.54 |
324.19 - 328.61 |
0.1269 times |
Fri 29 August 2025 |
325.24 (-2.34%) |
332.81 |
324.19 - 335.00 |
0.7271 times |
Fri 22 August 2025 |
333.03 (2.15%) |
325.48 |
320.64 - 333.22 |
0.8414 times |
Monthly price and charts SnapOn Strong monthly Stock price targets for SnapOn SNA are 318.18 and 349.14 | Monthly Target 1 | 310.62 | | Monthly Target 2 | 325.74 | | Monthly Target 3 | 341.57666666667 | | Monthly Target 4 | 356.7 | | Monthly Target 5 | 372.54 |
Monthly price and volumes Snap On
| Date |
Closing |
Open |
Range |
Volume |
Mon 20 October 2025 |
340.87 (-1.63%) |
344.12 |
326.45 - 357.41 |
0.7962 times |
Tue 30 September 2025 |
346.53 (6.55%) |
323.02 |
319.20 - 347.88 |
0.8999 times |
Fri 29 August 2025 |
325.24 (1.26%) |
317.81 |
312.78 - 335.00 |
0.6421 times |
Thu 31 July 2025 |
321.19 (3.22%) |
310.87 |
308.52 - 342.57 |
1.0895 times |
Mon 30 June 2025 |
311.18 (-2.98%) |
319.90 |
301.82 - 323.68 |
0.8975 times |
Fri 30 May 2025 |
320.75 (2.21%) |
314.70 |
309.57 - 332.45 |
0.8414 times |
Wed 30 April 2025 |
313.81 (-6.88%) |
334.79 |
289.81 - 343.43 |
1.4148 times |
Mon 31 March 2025 |
337.01 (-1.22%) |
342.31 |
322.25 - 347.84 |
1.1608 times |
Fri 28 February 2025 |
341.17 (-3.94%) |
349.44 |
330.49 - 358.63 |
1.0351 times |
Fri 31 January 2025 |
355.15 (4.62%) |
342.18 |
328.59 - 365.78 |
1.2227 times |
Tue 31 December 2024 |
339.48 (-8.58%) |
358.08 |
336.47 - 359.60 |
0.8826 times |

DMA SMA EMA moving averages of Snap On SNA
DMA (daily moving average) of Snap On SNA
| DMA period | DMA value | | 5 day DMA | 338.88 | | 12 day DMA | 337.47 | | 20 day DMA | 339.68 | | 35 day DMA | 335.86 | | 50 day DMA | 333.14 | | 100 day DMA | 326.31 | | 150 day DMA | 325.32 | | 200 day DMA | 329.35 | EMA (exponential moving average) of Snap On SNA
| EMA period | EMA current | EMA prev | EMA prev2 | | 5 day EMA | 339.08 | 338.18 | 337.4 | | 12 day EMA | 338.25 | 337.77 | 337.41 | | 20 day EMA | 337.7 | 337.37 | 337.12 | | 35 day EMA | 335.49 | 335.17 | 334.9 | | 50 day EMA | 332.82 | 332.49 | 332.19 |
SMA (simple moving average) of Snap On SNA
| SMA period | SMA current | SMA prev | SMA prev2 | | 5 day SMA | 338.88 | 337.1 | 334.62 | | 12 day SMA | 337.47 | 338.15 | 338.61 | | 20 day SMA | 339.68 | 339.51 | 339.38 | | 35 day SMA | 335.86 | 335.41 | 335 | | 50 day SMA | 333.14 | 332.75 | 332.39 | | 100 day SMA | 326.31 | 326.16 | 325.96 | | 150 day SMA | 325.32 | 325.24 | 325.19 | | 200 day SMA | 329.35 | 329.32 | 329.3 |
|
|
