SanchezEnergy SN full analysis,charts,indicators,moving averages,SMA,DMA,EMA,ADX,MACD,RSISanchez Energy SN WideScreen charts, DMA,SMA,EMA technical analysis, forecast prediction, by indicators ADX,MACD,RSI,CCI NYSE stock exchange
Daily price and charts and targets SanchezEnergy Strong Daily Stock price targets for SanchezEnergy SN are 92.34 and 94.83 | Daily Target 1 | 90.31 | | Daily Target 2 | 91.88 | | Daily Target 3 | 92.8 | | Daily Target 4 | 94.37 | | Daily Target 5 | 95.29 |
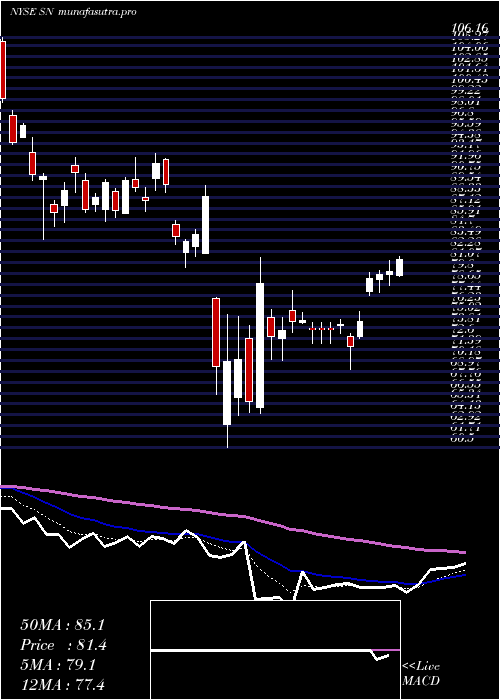
Daily price and volume Sanchez Energy
| Date |
Closing |
Open |
Range |
Volume |
Tue 21 October 2025 |
93.45 (0.69%) |
92.95 |
91.23 - 93.72 |
0.8723 times |
Mon 20 October 2025 |
92.81 (-1.18%) |
93.93 |
91.78 - 95.00 |
0.6689 times |
Fri 17 October 2025 |
93.92 (-0.01%) |
93.58 |
93.54 - 95.33 |
0.7538 times |
Thu 16 October 2025 |
93.93 (-0.94%) |
95.66 |
93.06 - 96.60 |
1.2128 times |
Wed 15 October 2025 |
94.82 (3.76%) |
91.91 |
91.91 - 95.01 |
1.8753 times |
Tue 14 October 2025 |
91.38 (2.44%) |
88.15 |
87.90 - 91.88 |
0.9984 times |
Mon 13 October 2025 |
89.20 (-2.81%) |
89.48 |
89.08 - 91.20 |
0.8432 times |
Tue 07 October 2025 |
91.78 (-2.72%) |
94.56 |
90.11 - 94.56 |
1.2834 times |
Mon 06 October 2025 |
94.35 (-4.21%) |
99.46 |
93.44 - 99.46 |
0.8826 times |
Fri 03 October 2025 |
98.50 (-2.7%) |
101.66 |
97.35 - 102.01 |
0.6092 times |
Thu 02 October 2025 |
101.23 (0.89%) |
100.98 |
98.57 - 101.24 |
0.5276 times |
Weekly price and charts SanchezEnergy Strong weekly Stock price targets for SanchezEnergy SN are 90.46 and 94.23 | Weekly Target 1 | 89.46 | | Weekly Target 2 | 91.45 | | Weekly Target 3 | 93.226666666667 | | Weekly Target 4 | 95.22 | | Weekly Target 5 | 97 |
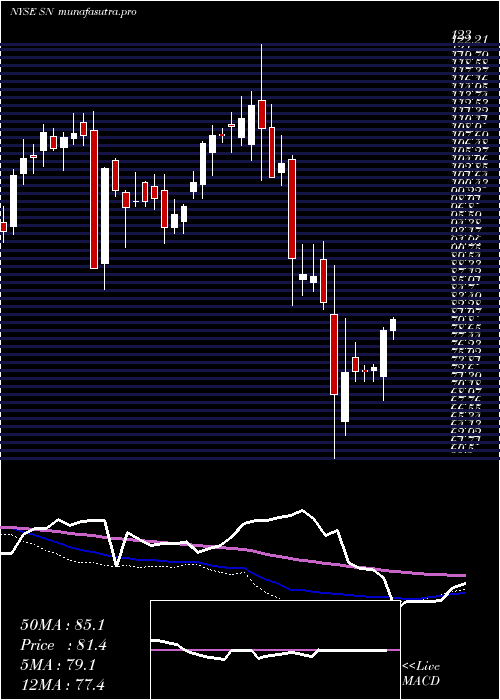
Weekly price and volumes for Sanchez Energy
| Date |
Closing |
Open |
Range |
Volume |
Tue 21 October 2025 |
93.45 (-0.5%) |
93.93 |
91.23 - 95.00 |
0.5196 times |
Fri 17 October 2025 |
93.92 (2.33%) |
89.48 |
87.90 - 96.60 |
1.9162 times |
Tue 07 October 2025 |
91.78 (-6.82%) |
99.46 |
90.11 - 99.46 |
0.7302 times |
Fri 03 October 2025 |
98.50 (-6.99%) |
107.35 |
97.35 - 107.75 |
1.6107 times |
Fri 26 September 2025 |
105.90 (-7.88%) |
114.51 |
104.92 - 114.59 |
1.1251 times |
Fri 19 September 2025 |
114.96 (0.9%) |
114.36 |
111.12 - 117.06 |
0.952 times |
Fri 12 September 2025 |
113.93 (-2.77%) |
118.00 |
113.60 - 118.00 |
0.7162 times |
Fri 05 September 2025 |
117.18 (0.19%) |
115.11 |
114.17 - 122.98 |
0.9287 times |
Fri 29 August 2025 |
116.96 (0%) |
116.53 |
114.76 - 117.34 |
0.2099 times |
Fri 29 August 2025 |
116.96 (0.03%) |
116.91 |
113.59 - 120.61 |
1.2913 times |
Fri 22 August 2025 |
116.92 (-1.71%) |
118.96 |
113.22 - 120.34 |
1.5876 times |
Monthly price and charts SanchezEnergy Strong monthly Stock price targets for SanchezEnergy SN are 83.02 and 98.33 | Monthly Target 1 | 79.54 | | Monthly Target 2 | 86.5 | | Monthly Target 3 | 94.853333333333 | | Monthly Target 4 | 101.81 | | Monthly Target 5 | 110.16 |
Monthly price and volumes Sanchez Energy
| Date |
Closing |
Open |
Range |
Volume |
Tue 21 October 2025 |
93.45 (-9.4%) |
102.52 |
87.90 - 103.21 |
0.727 times |
Tue 30 September 2025 |
103.15 (-11.81%) |
115.11 |
97.66 - 122.98 |
0.8703 times |
Fri 29 August 2025 |
116.96 (0.74%) |
112.97 |
110.59 - 128.51 |
1.0942 times |
Thu 31 July 2025 |
116.10 (17.28%) |
98.89 |
98.06 - 121.82 |
1.033 times |
Mon 30 June 2025 |
98.99 (7.68%) |
92.00 |
80.69 - 99.64 |
1.0959 times |
Fri 30 May 2025 |
91.93 (14.2%) |
80.97 |
78.82 - 104.97 |
1.1699 times |
Wed 30 April 2025 |
80.50 (-3.49%) |
82.85 |
60.50 - 89.69 |
1.6096 times |
Mon 31 March 2025 |
83.41 (-20.63%) |
105.70 |
80.54 - 106.16 |
0.9477 times |
Fri 28 February 2025 |
105.09 (-6.01%) |
107.90 |
101.74 - 123.00 |
0.8406 times |
Fri 31 January 2025 |
111.81 (14.84%) |
97.56 |
95.92 - 115.20 |
0.6118 times |
Tue 31 December 2024 |
97.36 (-1.92%) |
101.56 |
92.88 - 103.36 |
0.4256 times |

DMA SMA EMA moving averages of Sanchez Energy SN
DMA (daily moving average) of Sanchez Energy SN
| DMA period | DMA value | | 5 day DMA | 93.79 | | 12 day DMA | 94.64 | | 20 day DMA | 99.96 | | 35 day DMA | 106.86 | | 50 day DMA | 110.18 | | 100 day DMA | 106.33 | | 150 day DMA | 98.99 | | 200 day DMA | 100.62 | EMA (exponential moving average) of Sanchez Energy SN
| EMA period | EMA current | EMA prev | EMA prev2 | | 5 day EMA | 93.5 | 93.52 | 93.87 | | 12 day EMA | 95.82 | 96.25 | 96.88 | | 20 day EMA | 99.2 | 99.8 | 100.53 | | 35 day EMA | 103.84 | 104.45 | 105.14 | | 50 day EMA | 108.92 | 109.55 | 110.23 |
SMA (simple moving average) of Sanchez Energy SN
| SMA period | SMA current | SMA prev | SMA prev2 | | 5 day SMA | 93.79 | 93.37 | 92.65 | | 12 day SMA | 94.64 | 95.45 | 96.57 | | 20 day SMA | 99.96 | 101.13 | 102.19 | | 35 day SMA | 106.86 | 107.51 | 108.3 | | 50 day SMA | 110.18 | 110.61 | 111.04 | | 100 day SMA | 106.33 | 106.35 | 106.39 | | 150 day SMA | 98.99 | 98.96 | 98.92 | | 200 day SMA | 100.62 | 100.64 | 100.67 |
|
|
