SeacorMarine SMHI full analysis,charts,indicators,moving averages,SMA,DMA,EMA,ADX,MACD,RSISeacor Marine SMHI WideScreen charts, DMA,SMA,EMA technical analysis, forecast prediction, by indicators ADX,MACD,RSI,CCI NYSE stock exchange
operates under Transportation sector & deals in Marine Transportation
Daily price and charts and targets SeacorMarine Strong Daily Stock price targets for SeacorMarine SMHI are 6.97 and 7.21 | Daily Target 1 | 6.91 | | Daily Target 2 | 7.03 | | Daily Target 3 | 7.15 | | Daily Target 4 | 7.27 | | Daily Target 5 | 7.39 |
Daily price and volume Seacor Marine
| Date |
Closing |
Open |
Range |
Volume |
Thu 04 December 2025 |
7.15 (-1.11%) |
7.20 |
7.03 - 7.27 |
0.6181 times |
Wed 03 December 2025 |
7.23 (8.72%) |
6.67 |
6.66 - 7.24 |
0.8427 times |
Tue 02 December 2025 |
6.65 (-5.67%) |
6.92 |
6.60 - 7.05 |
1.1982 times |
Mon 01 December 2025 |
7.05 (-0.98%) |
7.07 |
7.04 - 7.19 |
1.3182 times |
Fri 28 November 2025 |
7.12 (2.74%) |
6.94 |
6.94 - 7.22 |
0.2707 times |
Wed 26 November 2025 |
6.93 (-0.57%) |
6.91 |
6.91 - 7.08 |
0.7029 times |
Tue 25 November 2025 |
6.97 (-1.83%) |
7.19 |
6.97 - 7.23 |
0.5901 times |
Mon 24 November 2025 |
7.10 (3.2%) |
6.77 |
6.70 - 7.27 |
1.3173 times |
Fri 21 November 2025 |
6.88 (0.73%) |
6.83 |
6.71 - 7.05 |
1.6106 times |
Thu 20 November 2025 |
6.83 (-7.2%) |
7.52 |
6.81 - 7.52 |
1.5312 times |
Wed 19 November 2025 |
7.36 (-2.13%) |
7.41 |
7.25 - 7.55 |
0.6957 times |
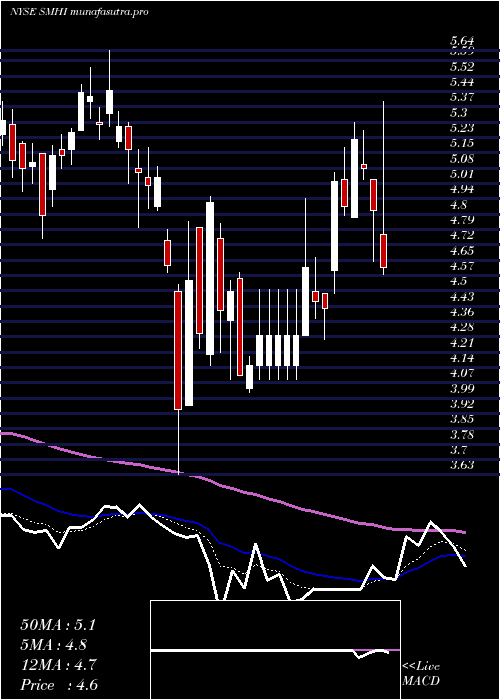
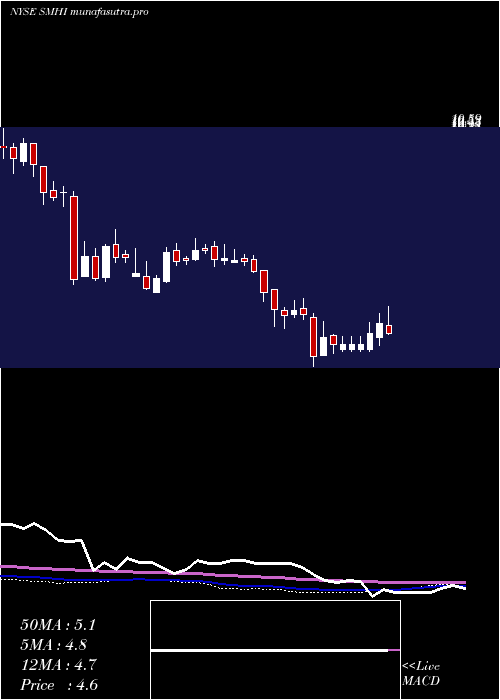
Weekly price and charts SeacorMarine Strong weekly Stock price targets for SeacorMarine SMHI are 6.88 and 7.55 | Weekly Target 1 | 6.34 | | Weekly Target 2 | 6.74 | | Weekly Target 3 | 7.0066666666667 | | Weekly Target 4 | 7.41 | | Weekly Target 5 | 7.68 |
Weekly price and volumes for Seacor Marine
| Date |
Closing |
Open |
Range |
Volume |
Thu 04 December 2025 |
7.15 (0.42%) |
7.07 |
6.60 - 7.27 |
1.2066 times |
Fri 28 November 2025 |
7.12 (3.49%) |
6.77 |
6.70 - 7.27 |
0.874 times |
Fri 21 November 2025 |
6.88 (-7.65%) |
7.47 |
6.71 - 7.85 |
1.7877 times |
Fri 14 November 2025 |
7.45 (9.56%) |
6.93 |
6.68 - 7.88 |
1.4847 times |
Fri 07 November 2025 |
6.80 (6.92%) |
7.00 |
6.40 - 7.19 |
0.9422 times |
Fri 31 October 2025 |
6.36 (0%) |
6.26 |
6.12 - 6.36 |
0.3413 times |
Fri 31 October 2025 |
6.36 (0.95%) |
6.35 |
5.80 - 6.50 |
1.0799 times |
Fri 24 October 2025 |
6.30 (11.7%) |
5.63 |
5.56 - 6.48 |
0.7846 times |
Fri 17 October 2025 |
5.64 (-9.32%) |
6.27 |
5.55 - 6.43 |
0.6938 times |
Fri 03 October 2025 |
6.22 (-9.99%) |
6.90 |
6.11 - 6.90 |
0.8051 times |
Fri 26 September 2025 |
6.91 (1.17%) |
6.71 |
6.61 - 7.17 |
0.6279 times |
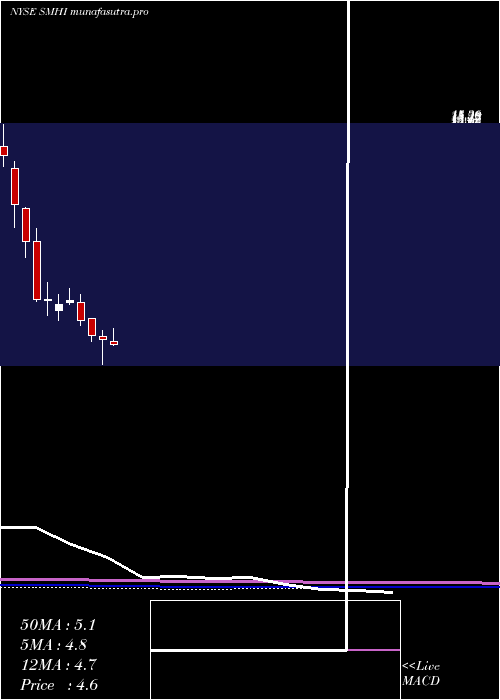
Monthly price and charts SeacorMarine Strong monthly Stock price targets for SeacorMarine SMHI are 6.88 and 7.55 | Monthly Target 1 | 6.34 | | Monthly Target 2 | 6.74 | | Monthly Target 3 | 7.0066666666667 | | Monthly Target 4 | 7.41 | | Monthly Target 5 | 7.68 |
Monthly price and volumes Seacor Marine
| Date |
Closing |
Open |
Range |
Volume |
Thu 04 December 2025 |
7.15 (0.42%) |
7.07 |
6.60 - 7.27 |
0.2267 times |
Fri 28 November 2025 |
7.12 (11.95%) |
7.00 |
6.40 - 7.88 |
0.9559 times |
Fri 31 October 2025 |
6.36 (-2%) |
6.47 |
5.55 - 6.63 |
0.6477 times |
Tue 30 September 2025 |
6.49 (1.25%) |
6.33 |
6.19 - 7.42 |
0.9603 times |
Fri 29 August 2025 |
6.41 (28.2%) |
4.92 |
4.70 - 6.84 |
1.0348 times |
Thu 31 July 2025 |
5.00 (-1.96%) |
5.08 |
4.85 - 5.90 |
1.0491 times |
Mon 30 June 2025 |
5.10 (-4.49%) |
5.48 |
5.00 - 6.29 |
1.2306 times |
Fri 30 May 2025 |
5.34 (9.43%) |
4.77 |
4.32 - 5.54 |
1.0953 times |
Wed 30 April 2025 |
4.88 (-3.56%) |
5.04 |
3.63 - 5.30 |
1.5416 times |
Mon 31 March 2025 |
5.06 (-12.61%) |
5.88 |
4.75 - 5.88 |
1.258 times |
Fri 28 February 2025 |
5.79 (-14.6%) |
6.69 |
5.55 - 7.06 |
1.2444 times |
DMA SMA EMA moving averages of Seacor Marine SMHI
DMA (daily moving average) of Seacor Marine SMHI
| DMA period | DMA value | | 5 day DMA | 7.04 | | 12 day DMA | 7.07 | | 20 day DMA | 7.15 | | 35 day DMA | 6.73 | | 50 day DMA | 6.68 | | 100 day DMA | 6.35 | | 150 day DMA | 5.98 | | 200 day DMA | 5.79 | EMA (exponential moving average) of Seacor Marine SMHI
| EMA period | EMA current | EMA prev | EMA prev2 | | 5 day EMA | 7.06 | 7.02 | 6.92 | | 12 day EMA | 7.06 | 7.04 | 7.01 | | 20 day EMA | 7.01 | 6.99 | 6.97 | | 35 day EMA | 6.9 | 6.89 | 6.87 | | 50 day EMA | 6.72 | 6.7 | 6.68 |
SMA (simple moving average) of Seacor Marine SMHI
| SMA period | SMA current | SMA prev | SMA prev2 | | 5 day SMA | 7.04 | 7 | 6.94 | | 12 day SMA | 7.07 | 7.11 | 7.13 | | 20 day SMA | 7.15 | 7.14 | 7.12 | | 35 day SMA | 6.73 | 6.69 | 6.66 | | 50 day SMA | 6.68 | 6.68 | 6.68 | | 100 day SMA | 6.35 | 6.33 | 6.31 | | 150 day SMA | 5.98 | 5.97 | 5.95 | | 200 day SMA | 5.79 | 5.78 | 5.78 |
|
|
