SunLife SLF full analysis,charts,indicators,moving averages,SMA,DMA,EMA,ADX,MACD,RSISun Life SLF WideScreen charts, DMA,SMA,EMA technical analysis, forecast prediction, by indicators ADX,MACD,RSI,CCI NYSE stock exchange
operates under Finance sector & deals in Life Insurance
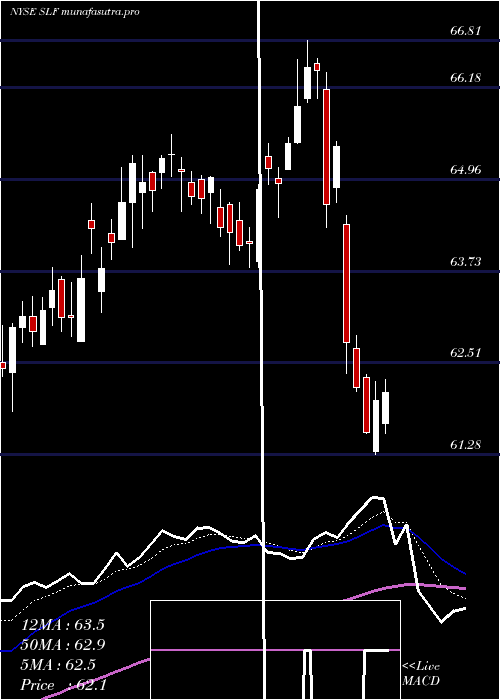
Daily price and charts and targets SunLife Strong Daily Stock price targets for SunLife SLF are 58.27 and 58.96 | Daily Target 1 | 57.71 | | Daily Target 2 | 58.14 | | Daily Target 3 | 58.396666666667 | | Daily Target 4 | 58.83 | | Daily Target 5 | 59.09 |
Daily price and volume Sun Life
| Date |
Closing |
Open |
Range |
Volume |
Fri 05 December 2025 |
58.58 (1.47%) |
57.96 |
57.96 - 58.65 |
0.698 times |
Thu 04 December 2025 |
57.73 (-0.16%) |
57.78 |
57.52 - 58.24 |
0.501 times |
Wed 03 December 2025 |
57.82 (0.38%) |
57.53 |
57.53 - 58.13 |
0.6672 times |
Tue 02 December 2025 |
57.60 (-0.19%) |
58.03 |
57.22 - 58.03 |
1.3172 times |
Mon 01 December 2025 |
57.71 (-2.38%) |
59.02 |
57.53 - 59.08 |
1.0256 times |
Fri 28 November 2025 |
59.12 (0.78%) |
58.68 |
58.63 - 59.43 |
0.5095 times |
Wed 26 November 2025 |
58.66 (-1.91%) |
59.24 |
58.66 - 59.25 |
1.8576 times |
Tue 25 November 2025 |
59.80 (1.18%) |
59.23 |
59.19 - 59.98 |
2.2296 times |
Mon 24 November 2025 |
59.10 (-0.81%) |
59.50 |
58.92 - 59.64 |
0.7983 times |
Fri 21 November 2025 |
59.58 (1.52%) |
58.85 |
58.81 - 59.89 |
0.396 times |
Thu 20 November 2025 |
58.69 (0.1%) |
59.04 |
58.50 - 59.15 |
0.4769 times |
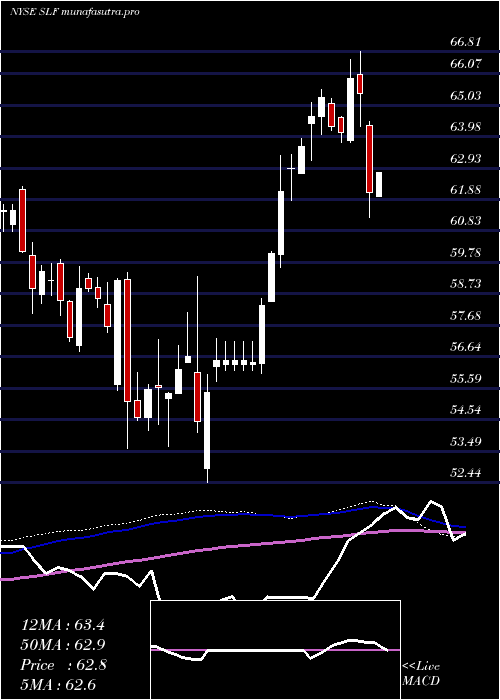
Weekly price and charts SunLife Strong weekly Stock price targets for SunLife SLF are 56.97 and 58.83 | Weekly Target 1 | 56.43 | | Weekly Target 2 | 57.51 | | Weekly Target 3 | 58.293333333333 | | Weekly Target 4 | 59.37 | | Weekly Target 5 | 60.15 |
Weekly price and volumes for Sun Life
| Date |
Closing |
Open |
Range |
Volume |
Fri 05 December 2025 |
58.58 (-0.91%) |
59.02 |
57.22 - 59.08 |
1.1943 times |
Fri 28 November 2025 |
59.12 (-0.77%) |
59.50 |
58.63 - 59.98 |
1.5309 times |
Fri 21 November 2025 |
59.58 (0.62%) |
59.21 |
58.39 - 59.89 |
0.9208 times |
Fri 14 November 2025 |
59.21 (1.14%) |
58.59 |
57.48 - 59.43 |
1.7409 times |
Fri 07 November 2025 |
58.54 (-3.81%) |
60.59 |
58.10 - 61.78 |
1.3202 times |
Fri 31 October 2025 |
60.86 (0%) |
60.80 |
60.64 - 61.25 |
0.2091 times |
Fri 31 October 2025 |
60.86 (-0.86%) |
61.72 |
60.64 - 62.38 |
0.8104 times |
Fri 24 October 2025 |
61.39 (1.37%) |
60.79 |
60.75 - 61.78 |
0.7934 times |
Fri 17 October 2025 |
60.56 (-0.44%) |
61.80 |
60.27 - 62.60 |
1.0733 times |
Tue 07 October 2025 |
60.83 (0.81%) |
60.64 |
60.23 - 61.22 |
0.4067 times |
Fri 03 October 2025 |
60.34 (2.38%) |
59.21 |
58.95 - 60.52 |
0.7923 times |
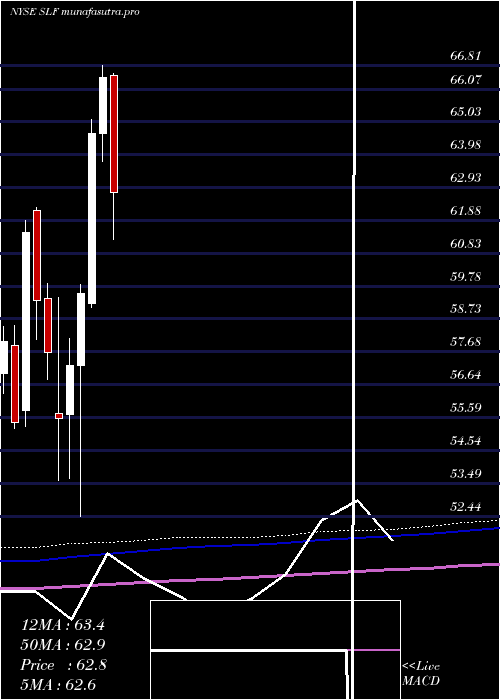
Monthly price and charts SunLife Strong monthly Stock price targets for SunLife SLF are 56.97 and 58.83 | Monthly Target 1 | 56.43 | | Monthly Target 2 | 57.51 | | Monthly Target 3 | 58.293333333333 | | Monthly Target 4 | 59.37 | | Monthly Target 5 | 60.15 |
Monthly price and volumes Sun Life
| Date |
Closing |
Open |
Range |
Volume |
Fri 05 December 2025 |
58.58 (-0.91%) |
59.02 |
57.22 - 59.08 |
0.1994 times |
Fri 28 November 2025 |
59.12 (-2.86%) |
60.59 |
57.48 - 61.78 |
0.9204 times |
Fri 31 October 2025 |
60.86 (1.38%) |
59.74 |
59.61 - 62.60 |
0.6226 times |
Tue 30 September 2025 |
60.03 (2.74%) |
57.87 |
57.45 - 60.27 |
0.85 times |
Fri 29 August 2025 |
58.43 (-4.21%) |
60.61 |
56.22 - 62.00 |
1.6674 times |
Thu 31 July 2025 |
61.00 (-8.2%) |
66.50 |
60.84 - 66.57 |
1.4424 times |
Mon 30 June 2025 |
66.45 (2.78%) |
64.65 |
63.77 - 66.81 |
0.9032 times |
Fri 30 May 2025 |
64.65 (8.56%) |
59.22 |
59.11 - 65.11 |
1.6757 times |
Wed 30 April 2025 |
59.55 (4%) |
57.24 |
52.44 - 59.82 |
0.7938 times |
Mon 31 March 2025 |
57.26 (3.08%) |
55.68 |
53.64 - 58.10 |
0.9251 times |
Fri 28 February 2025 |
55.55 (-3.64%) |
55.72 |
53.57 - 59.43 |
1.9952 times |
DMA SMA EMA moving averages of Sun Life SLF
DMA (daily moving average) of Sun Life SLF
| DMA period | DMA value | | 5 day DMA | 57.89 | | 12 day DMA | 58.59 | | 20 day DMA | 58.66 | | 35 day DMA | 59.76 | | 50 day DMA | 59.96 | | 100 day DMA | 59.81 | | 150 day DMA | 61 | | 200 day DMA | 59.76 | EMA (exponential moving average) of Sun Life SLF
| EMA period | EMA current | EMA prev | EMA prev2 | | 5 day EMA | 58.19 | 58 | 58.13 | | 12 day EMA | 58.5 | 58.48 | 58.62 | | 20 day EMA | 58.85 | 58.88 | 59 | | 35 day EMA | 59.25 | 59.29 | 59.38 | | 50 day EMA | 59.72 | 59.77 | 59.85 |
SMA (simple moving average) of Sun Life SLF
| SMA period | SMA current | SMA prev | SMA prev2 | | 5 day SMA | 57.89 | 58 | 58.18 | | 12 day SMA | 58.59 | 58.64 | 58.75 | | 20 day SMA | 58.66 | 58.69 | 58.88 | | 35 day SMA | 59.76 | 59.83 | 59.95 | | 50 day SMA | 59.96 | 59.98 | 60.03 | | 100 day SMA | 59.81 | 59.85 | 59.89 | | 150 day SMA | 61 | 61 | 61.01 | | 200 day SMA | 59.76 | 59.74 | 59.73 |
|
|
