SchlumbergerN SLB full analysis,charts,indicators,moving averages,SMA,DMA,EMA,ADX,MACD,RSISchlumberger N SLB WideScreen charts, DMA,SMA,EMA technical analysis, forecast prediction, by indicators ADX,MACD,RSI,CCI NYSE stock exchange
operates under Energy sector & deals in Oilfield Services Equipment
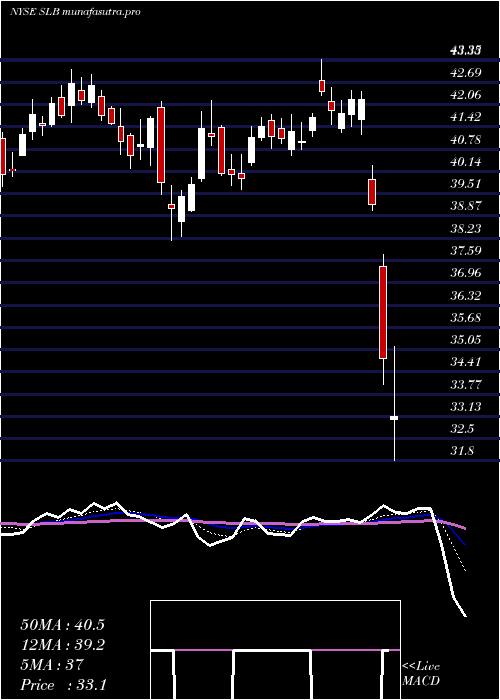
Daily price and charts and targets SchlumbergerN Strong Daily Stock price targets for SchlumbergerN SLB are 37.77 and 38.66 | Daily Target 1 | 37.05 | | Daily Target 2 | 37.59 | | Daily Target 3 | 37.943333333333 | | Daily Target 4 | 38.48 | | Daily Target 5 | 38.83 |
Daily price and volume Schlumberger N
| Date |
Closing |
Open |
Range |
Volume |
Thu 04 December 2025 |
38.12 (1.52%) |
37.50 |
37.41 - 38.30 |
1.0823 times |
Wed 03 December 2025 |
37.55 (3.3%) |
36.43 |
36.23 - 37.63 |
1.101 times |
Tue 02 December 2025 |
36.35 (-0.68%) |
36.74 |
35.51 - 36.99 |
0.575 times |
Mon 01 December 2025 |
36.60 (0.99%) |
36.25 |
36.23 - 36.98 |
0.8649 times |
Fri 28 November 2025 |
36.24 (1.6%) |
35.72 |
35.52 - 36.38 |
0.2738 times |
Wed 26 November 2025 |
35.67 (-0.64%) |
35.91 |
35.29 - 36.05 |
0.4644 times |
Tue 25 November 2025 |
35.90 (0.53%) |
35.82 |
35.01 - 35.95 |
0.9031 times |
Mon 24 November 2025 |
35.71 (-1.33%) |
36.00 |
35.30 - 36.08 |
2.5197 times |
Fri 21 November 2025 |
36.19 (2.84%) |
35.17 |
34.65 - 36.33 |
1.4162 times |
Thu 20 November 2025 |
35.19 (-1.87%) |
36.21 |
35.09 - 36.84 |
0.7996 times |
Wed 19 November 2025 |
35.86 (-0.5%) |
35.38 |
35.12 - 36.13 |
0.6626 times |
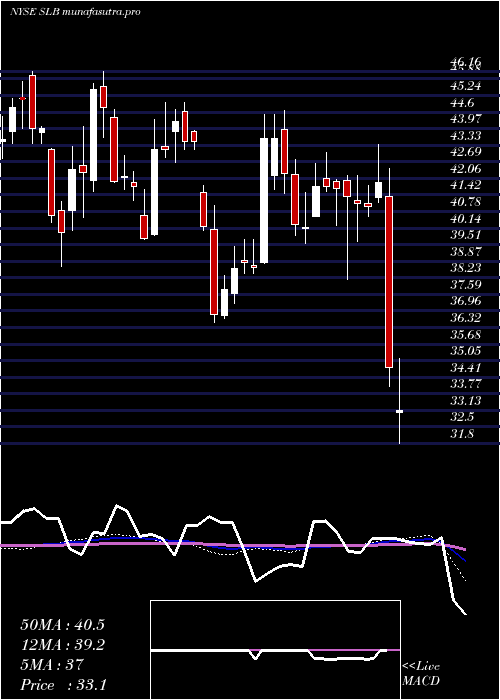
Weekly price and charts SchlumbergerN Strong weekly Stock price targets for SchlumbergerN SLB are 36.82 and 39.61 | Weekly Target 1 | 34.52 | | Weekly Target 2 | 36.32 | | Weekly Target 3 | 37.31 | | Weekly Target 4 | 39.11 | | Weekly Target 5 | 40.1 |
Weekly price and volumes for Schlumberger N
| Date |
Closing |
Open |
Range |
Volume |
Thu 04 December 2025 |
38.12 (5.19%) |
36.25 |
35.51 - 38.30 |
0.8999 times |
Fri 28 November 2025 |
36.24 (0.14%) |
36.00 |
35.01 - 36.38 |
1.0335 times |
Fri 21 November 2025 |
36.19 (-2.03%) |
36.82 |
34.65 - 36.93 |
1.0994 times |
Fri 14 November 2025 |
36.94 (0.76%) |
36.88 |
35.88 - 38.08 |
0.8027 times |
Fri 07 November 2025 |
36.66 (1.66%) |
36.53 |
35.79 - 37.21 |
0.8626 times |
Fri 31 October 2025 |
36.06 (0%) |
36.26 |
35.78 - 36.53 |
0.2574 times |
Fri 31 October 2025 |
36.06 (0.67%) |
36.17 |
35.69 - 37.05 |
1.3107 times |
Fri 24 October 2025 |
35.82 (9.78%) |
32.91 |
32.50 - 36.64 |
1.2146 times |
Fri 17 October 2025 |
32.63 (-5.17%) |
32.08 |
31.64 - 33.26 |
2.0706 times |
Tue 07 October 2025 |
34.41 (0.44%) |
34.52 |
34.05 - 35.10 |
0.4486 times |
Fri 03 October 2025 |
34.26 (-3.55%) |
35.33 |
33.42 - 35.34 |
1.0727 times |
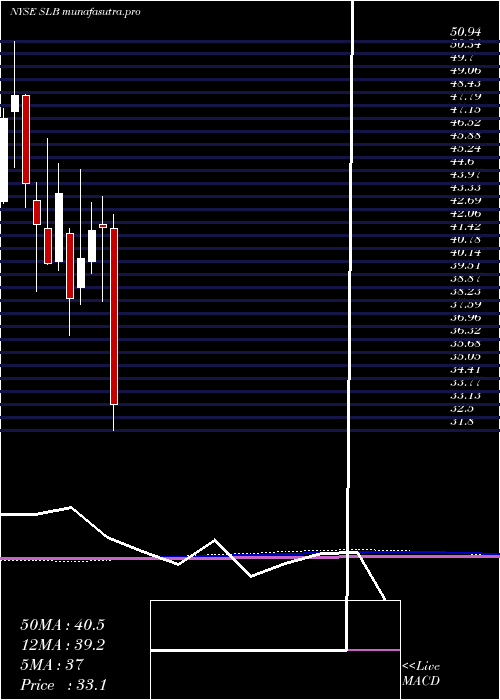
Monthly price and charts SchlumbergerN Strong monthly Stock price targets for SchlumbergerN SLB are 36.82 and 39.61 | Monthly Target 1 | 34.52 | | Monthly Target 2 | 36.32 | | Monthly Target 3 | 37.31 | | Monthly Target 4 | 39.11 | | Monthly Target 5 | 40.1 |
Monthly price and volumes Schlumberger N
| Date |
Closing |
Open |
Range |
Volume |
Thu 04 December 2025 |
38.12 (5.19%) |
36.25 |
35.51 - 38.30 |
0.1759 times |
Fri 28 November 2025 |
36.24 (0.5%) |
36.53 |
34.65 - 38.08 |
0.7422 times |
Fri 31 October 2025 |
36.06 (4.92%) |
34.22 |
31.64 - 37.05 |
1.1356 times |
Tue 30 September 2025 |
34.37 (-6.7%) |
36.68 |
33.42 - 36.76 |
1.2519 times |
Fri 29 August 2025 |
36.84 (8.99%) |
33.61 |
32.15 - 37.05 |
0.8507 times |
Thu 31 July 2025 |
33.80 (0%) |
33.80 |
33.17 - 38.15 |
1.3443 times |
Mon 30 June 2025 |
33.80 (2.27%) |
33.74 |
32.83 - 36.60 |
1.0024 times |
Fri 30 May 2025 |
33.05 (-0.6%) |
33.20 |
32.84 - 36.87 |
0.9046 times |
Wed 30 April 2025 |
33.25 (-20.45%) |
41.78 |
31.11 - 42.45 |
1.4811 times |
Mon 31 March 2025 |
41.80 (0.34%) |
41.98 |
38.17 - 43.35 |
1.1114 times |
Fri 28 February 2025 |
41.66 (3.43%) |
40.13 |
39.56 - 43.06 |
0.8203 times |
DMA SMA EMA moving averages of Schlumberger N SLB
DMA (daily moving average) of Schlumberger N SLB
| DMA period | DMA value | | 5 day DMA | 36.97 | | 12 day DMA | 36.29 | | 20 day DMA | 36.4 | | 35 day DMA | 35.92 | | 50 day DMA | 35.4 | | 100 day DMA | 35.07 | | 150 day DMA | 34.91 | | 200 day DMA | 35.84 | EMA (exponential moving average) of Schlumberger N SLB
| EMA period | EMA current | EMA prev | EMA prev2 | | 5 day EMA | 37.15 | 36.67 | 36.23 | | 12 day EMA | 36.61 | 36.34 | 36.12 | | 20 day EMA | 36.36 | 36.17 | 36.03 | | 35 day EMA | 35.9 | 35.77 | 35.66 | | 50 day EMA | 35.51 | 35.4 | 35.31 |
SMA (simple moving average) of Schlumberger N SLB
| SMA period | SMA current | SMA prev | SMA prev2 | | 5 day SMA | 36.97 | 36.48 | 36.15 | | 12 day SMA | 36.29 | 36.09 | 36.04 | | 20 day SMA | 36.4 | 36.33 | 36.25 | | 35 day SMA | 35.92 | 35.76 | 35.62 | | 50 day SMA | 35.4 | 35.32 | 35.27 | | 100 day SMA | 35.07 | 35.06 | 35.04 | | 150 day SMA | 34.91 | 34.89 | 34.87 | | 200 day SMA | 35.84 | 35.86 | 35.88 |
|
|
