TangerFactory SKT full analysis,charts,indicators,moving averages,SMA,DMA,EMA,ADX,MACD,RSITanger Factory SKT WideScreen charts, DMA,SMA,EMA technical analysis, forecast prediction, by indicators ADX,MACD,RSI,CCI NYSE stock exchange
operates under Consumer Services sector & deals in Real Estate Investment Trusts
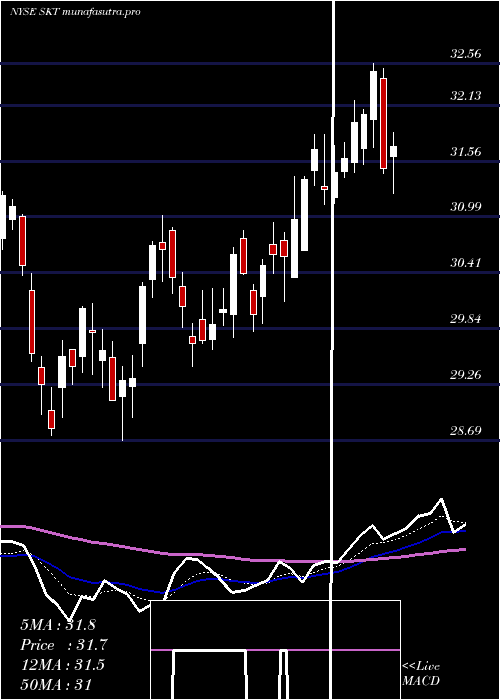
Daily price and charts and targets TangerFactory Strong Daily Stock price targets for TangerFactory SKT are 32.56 and 32.9 | Daily Target 1 | 32.3 | | Daily Target 2 | 32.47 | | Daily Target 3 | 32.636666666667 | | Daily Target 4 | 32.81 | | Daily Target 5 | 32.98 |
Daily price and volume Tanger Factory
| Date |
Closing |
Open |
Range |
Volume |
Tue 21 October 2025 |
32.65 (0.09%) |
32.62 |
32.46 - 32.80 |
1.1239 times |
Mon 20 October 2025 |
32.62 (-0.24%) |
32.71 |
32.31 - 32.87 |
0.8365 times |
Fri 17 October 2025 |
32.70 (1.14%) |
32.30 |
32.11 - 32.77 |
0.8364 times |
Thu 16 October 2025 |
32.33 (-0.89%) |
32.57 |
32.11 - 32.88 |
0.7303 times |
Wed 15 October 2025 |
32.62 (0.25%) |
32.62 |
32.32 - 33.08 |
0.9984 times |
Tue 14 October 2025 |
32.54 (0.12%) |
32.39 |
32.18 - 32.72 |
1.115 times |
Mon 13 October 2025 |
32.50 (-1.72%) |
32.06 |
31.81 - 32.58 |
0.8138 times |
Tue 07 October 2025 |
33.07 (-0.93%) |
33.27 |
33.00 - 33.46 |
1.5551 times |
Mon 06 October 2025 |
33.38 (-1.88%) |
34.00 |
33.34 - 34.15 |
0.7092 times |
Fri 03 October 2025 |
34.02 (0.86%) |
33.96 |
33.61 - 34.40 |
1.2813 times |
Thu 02 October 2025 |
33.73 (-0.18%) |
33.63 |
33.33 - 33.77 |
0.7129 times |
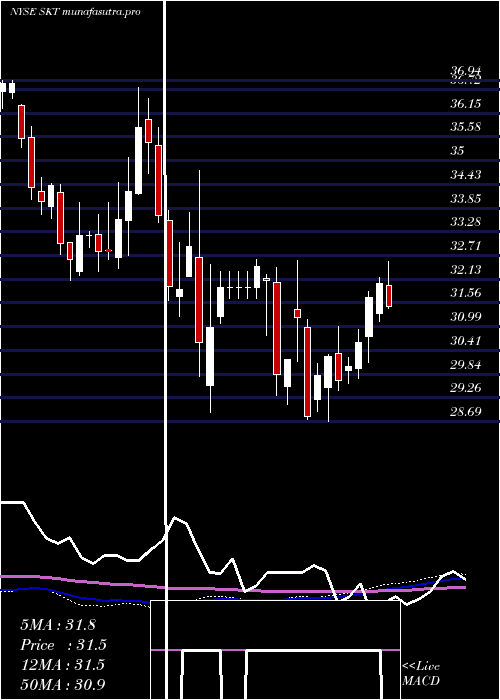
Weekly price and charts TangerFactory Strong weekly Stock price targets for TangerFactory SKT are 32.2 and 32.76 | Weekly Target 1 | 32.05 | | Weekly Target 2 | 32.35 | | Weekly Target 3 | 32.61 | | Weekly Target 4 | 32.91 | | Weekly Target 5 | 33.17 |
Weekly price and volumes for Tanger Factory
| Date |
Closing |
Open |
Range |
Volume |
Tue 21 October 2025 |
32.65 (-0.15%) |
32.71 |
32.31 - 32.87 |
0.4878 times |
Fri 17 October 2025 |
32.70 (-1.12%) |
32.06 |
31.81 - 33.08 |
1.1183 times |
Tue 07 October 2025 |
33.07 (-2.79%) |
34.00 |
33.00 - 34.15 |
0.5634 times |
Fri 03 October 2025 |
34.02 (1.1%) |
33.53 |
33.11 - 34.40 |
1.3746 times |
Fri 26 September 2025 |
33.65 (0.72%) |
33.33 |
32.83 - 33.73 |
0.9497 times |
Fri 19 September 2025 |
33.41 (-2.08%) |
34.14 |
33.25 - 34.72 |
2.2987 times |
Fri 12 September 2025 |
34.12 (-1.9%) |
34.43 |
34.01 - 34.79 |
1.0998 times |
Fri 05 September 2025 |
34.78 (1.76%) |
33.69 |
33.23 - 34.86 |
0.98 times |
Fri 29 August 2025 |
34.18 (0%) |
34.07 |
33.86 - 34.24 |
0.245 times |
Fri 29 August 2025 |
34.18 (2.03%) |
33.45 |
33.08 - 34.24 |
0.8827 times |
Fri 22 August 2025 |
33.50 (3.62%) |
32.44 |
32.13 - 33.75 |
0.9377 times |
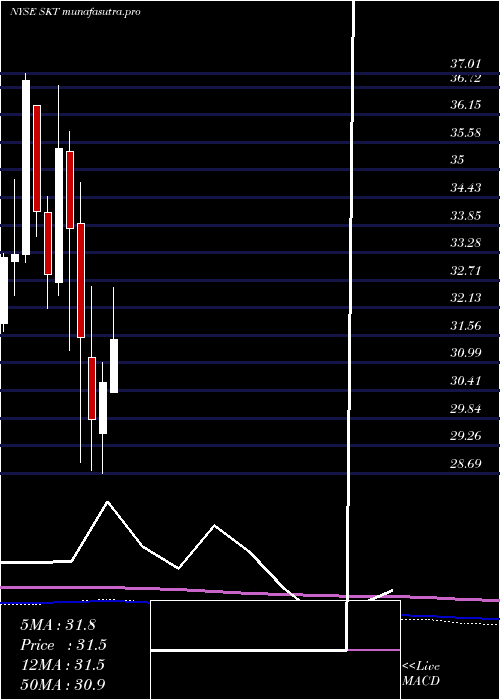
Monthly price and charts TangerFactory Strong monthly Stock price targets for TangerFactory SKT are 30.94 and 33.53 | Monthly Target 1 | 30.36 | | Monthly Target 2 | 31.51 | | Monthly Target 3 | 32.953333333333 | | Monthly Target 4 | 34.1 | | Monthly Target 5 | 35.54 |
Monthly price and volumes Tanger Factory
| Date |
Closing |
Open |
Range |
Volume |
Tue 21 October 2025 |
32.65 (-3.52%) |
33.58 |
31.81 - 34.40 |
0.5519 times |
Tue 30 September 2025 |
33.84 (-0.99%) |
33.69 |
32.83 - 34.86 |
1.0796 times |
Fri 29 August 2025 |
34.18 (13.86%) |
29.93 |
29.24 - 34.24 |
0.9782 times |
Thu 31 July 2025 |
30.02 (-1.83%) |
30.36 |
29.93 - 32.56 |
1.0781 times |
Mon 30 June 2025 |
30.58 (2.62%) |
29.51 |
28.69 - 31.00 |
1.137 times |
Fri 30 May 2025 |
29.80 (-5.43%) |
31.09 |
28.74 - 32.58 |
1.3548 times |
Wed 30 April 2025 |
31.51 (-6.75%) |
33.88 |
28.92 - 34.75 |
1.2101 times |
Mon 31 March 2025 |
33.79 (-4.68%) |
35.38 |
31.24 - 35.80 |
0.9553 times |
Fri 28 February 2025 |
35.45 (8.01%) |
32.66 |
32.39 - 36.76 |
0.8823 times |
Fri 31 January 2025 |
32.82 (-3.84%) |
34.12 |
32.11 - 34.44 |
0.7726 times |
Tue 31 December 2024 |
34.13 (-7.43%) |
36.34 |
33.61 - 36.35 |
0.6576 times |
DMA SMA EMA moving averages of Tanger Factory SKT
DMA (daily moving average) of Tanger Factory SKT
| DMA period | DMA value | | 5 day DMA | 32.58 | | 12 day DMA | 33 | | 20 day DMA | 33.16 | | 35 day DMA | 33.58 | | 50 day DMA | 33.35 | | 100 day DMA | 32.05 | | 150 day DMA | 31.86 | | 200 day DMA | 32.34 | EMA (exponential moving average) of Tanger Factory SKT
| EMA period | EMA current | EMA prev | EMA prev2 | | 5 day EMA | 32.65 | 32.65 | 32.67 | | 12 day EMA | 32.89 | 32.93 | 32.99 | | 20 day EMA | 33.07 | 33.11 | 33.16 | | 35 day EMA | 33.07 | 33.1 | 33.13 | | 50 day EMA | 33.11 | 33.13 | 33.15 |
SMA (simple moving average) of Tanger Factory SKT
| SMA period | SMA current | SMA prev | SMA prev2 | | 5 day SMA | 32.58 | 32.56 | 32.54 | | 12 day SMA | 33 | 33.1 | 33.15 | | 20 day SMA | 33.16 | 33.21 | 33.28 | | 35 day SMA | 33.58 | 33.62 | 33.66 | | 50 day SMA | 33.35 | 33.34 | 33.34 | | 100 day SMA | 32.05 | 32.02 | 31.98 | | 150 day SMA | 31.86 | 31.85 | 31.86 | | 200 day SMA | 32.34 | 32.35 | 32.35 |
|
|
